Tchater maintenant avec le support
Tchattez avec un ingénieur du support

Foglight for VMware 5.8.2 - User and Reference Guide

Using Foglight for VMware
Introducing the virtual infrastructure Navigation basics Interacting with Foglight for VMware VMware Performance Agent configuration
Reference
Views
VMware Alarms views VMware Explorer views VMware Modeler views VMware VirtualCenter views VMware Environment views Other views
Rules
Agent Rules Cluster Rules Datacenter Rules Datastore Rules Resource Pool Rules ESX Server Rules VirtualCenter Rules Virtual Machine Rules VMW Stale Data Management Rule Virtual Switch Rules
Appendix: Alarm Messages Appendix: Metrics

Reference

This contains reference information about views, rules, and data tables that are included with Foglight® for VMware. Read this to find out details about these components.

Views

Foglight® for VMware ships with predefined views to help you monitor your application server environment. This provides quick reference information about each view.

Foglight for VMware displays monitoring data in views that group, format, and display data. The main types are described below.

Dashboards are top-level views that do not receive data from other views. Dashboards usually contain a number of lower-level views. The dashboards supplied with Foglight for VMware, as well as those created by users, are available in the navigation panel.

Lower-level views in Foglight for VMware can be added to dashboards or can be accessed by drilling down from a dashboard. They receive and display data directly from the Foglight for VMware Management Server or from other views. Some views filter or select data that appears in other views in the same dashboard. Some are tree views with expandable nodes for selecting servers, applications, or data.

Foglight for VMware ships with several dashboards that allow you to monitor and configure your virtual environment. Each of these dashboards contains a number of views. This section describes these views in more detail. For more information about the VMware dashboards, see Interacting with Foglight for VMware.

Foglight for VMware includes the following groups of views:

VMware Alarms views

The VMware Alarms dashboard contains the following views:

Alarms Overview

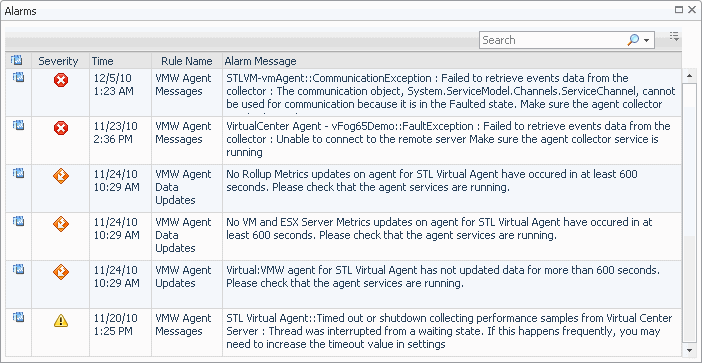
The Alarms Overview provides a quick and easy way for you to view Foglight for VMware alarms grouped by object type and severity level. You can use this Overview to monitor alarms and to identify the sources of problems within the virtual infrastructure. If you click any of the alarm counts for a particular object type, a popup displaying just the alarms for that object type appears.

Figure 59. Alarms Overview

For more information about the VMware Alarms dashboard on which this view appears, see Exploring VMware alarms .

The Alarms Overview appears at the top of this dashboard.
Alarm counts. The total counts of alarms associated with the various components, broken down by alarm types (Normal, Warning, Critical, Fatal).
Drill down on any alarm count. Displays the Alarms dialog box that shows a list of all alarms associated with the selected component type.
Documents connexes

The document was helpful.

Sélectionner une évaluation

I easily found the information I needed.

Sélectionner une évaluation