
Getting Started
Introducing Foglight for Storage Management
Navigating Foglight for Storage Management
Introducing the Storage Monitoring Architecture
Sizing Your Monitored Environment
Ensuring System Requirements are Met
Configuring Agents to Monitor Storage Devices
Small Environment System Requirements
Large Environment System Requirements
Requirements for Agent Managers
Installed Dashboards and Cartridges
Configuring Agent Managers for Storage Collection
Installing External Agent Managers
Creating a Lockbox for Foglight for Storage Management Credentials
Supporting an Environment with Separate Fabrics that have Duplicated WWNs
Configuring Storage Collector Agents
Configuring VMware Performance Agents
Configuring Hyper-V Agents
Assigning Foglight for Storage Management Roles
Brocade SAN Switches
Cisco SAN Switches
Managing Agents
Requirements for Cisco SAN Switches
Ensuring that SSH is Enabled on Switches
Configuring Agents to Monitor Cisco SAN Switches
Dell Compellent Arrays
Dell EqualLogic PS Series Array Groups
EMC CLARiiON CX Series Arrays (CLI)
Requirements for EMC CLARiiON CX Series Arrays (CLI)
Configuring Agents to Monitor EMC CLARiiON CX Series Arrays (CLI)
EMC CLARiiON, VNX, or VMAX Storage Arrays (SMI-S)
Requirements for EMC CLARiiON or VNX Arrays (SMI-S)
Requirements for EMC VMAX Arrays (SMI-S)
Configuring Agents to Monitor EMC Storage Arrays (SMI-S)
Configuring the SMI-S Provider for EMC CLARiiON or VNX
Verifying Statistics Logging is Enabled on EMC Arrays
EMC Isilon
EMC VPLEX
Hitachi Data Systems AMS, USP, and VSP
Requirements for Hitachi Data Systems AMS, USP, VSP
Configuring Agents to Monitor Hitachi Data Systems AMS
Configuring Agents to Monitor Hitachi Data Systems USP and VSP Arrays
HP EVA Storage Arrays
HP 3PAR Arrays
Requirements for HP 3PAR Arrays
Enabling the SMI-S Provider
Configuring Agents to Monitor HP 3PAR Arrays
NetApp Filers
Configuration Procedures
Configuring Agents to Monitor Storage Devices
Assigning Credentials
Creating and assigning new credentials
Selecting and assigning an existing credential
About releasing the Agent Manager lockbox
Resolving Connection Attempt Errors
Configuring the Hitachi Tuning Manager
Configuring Generic SMI-S Array Agent to Monitor Storage Devices
Managing certificates
Reviewing the Status of Configured Storage Collector Agents
Reviewing Agent Alarms
Editing Configured Agents
Using Foglight for Storage Management
Reviewing Agent Status and Validating Connectivity
Managing Credentials
Managing Discovered Switches and Arrays
Managing CLARiiON Domains and Arrays
Managing the Hitachi Tuning Manager
Deploying Storage Agents after an Upgrade
Verifying StorageCollector/Generic SMIS Storage Agents are Collecting Storage Data
Understanding Metric Data in Charts and Tables
Modifying and Extending Data Collection
Next Steps
Monitoring Storage Performance
Introducing the Storage Environment Dashboard
Monitoring Your Storage Environment
Investigating Storage Devices
Understanding Status, Alarms, and Rules in Foglight for Storage Management
Reviewing the Status of All Devices
Assessing Storage Alarms
Monitoring Fabrics
Monitoring Storage Arrays
Monitoring Filers
Asking Questions About the Monitored Storage Environment
Assessing Connectivity and I/O Performance
Introducing the Virtualization Dashboards
Summary of Icons Used in Topology Diagrams
Exploring Connectivity with SAN Topology Diagrams
Exploring I/O Performance with SAN Data Paths
Monitoring Storage Capacity
Capacity Trending
Evaluating Pool Capacity
Environment Summary/Monitoring/Summary
Capacity Reports
Low Capacity Rule
Storage Capacity tab
Creating Storage Reports
Introducing the Storage Explorer
Exploring a Fabric
Exploring a Switch
Exploring a Cisco VSAN
Exploring a Filer
Exploring a Storage Array
Investigating Storage Components
Non-Clustered Storage Arrays
Dell EqualLogic Storage Array
EMC VPLEX Storage Array
EMC Isilon Storage Array
Common Data for Filers and Storage Arrays
Introducing Storage Component Dashboards
Investigating an Aggregate
Investigating an Array/Filer Port
Investigating a Controller
Investigating a Directory
Investigating an EqualLogic Member
Investigating an FC Switch Port
Investigating an Isilon Node
Investigating a LUN
Investigating a NASVolume
Investigating a Physical Disk
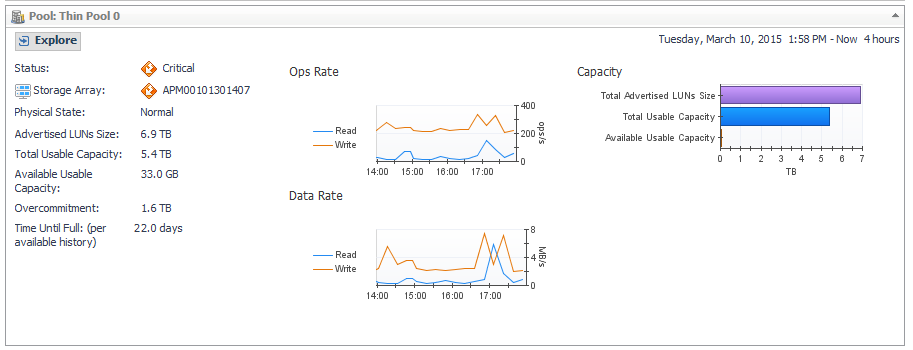
Investigating a Pool
Investigating VPLEX Storage
Pool belonging to a non-clustered storage array or EqualLogic storage array
Pool belonging to an Isilon storage array
Common Component Disk Tab Data
Introducing VPLEX Virtualization Components Dashboards
Investigating Director - Ports
Investigating a Virtual Volume
Investigating a Storage Volume
Troubleshooting Storage Performance
Starting a Troubleshooting Investigation
Analyzing Storage Issues
Analyzing the Pool
Changing Latency Thresholds
Understanding the Troubleshooting Algorithm
Managing Data Collection, Rules, and Alarms
Collecting Virtual Storage-to-SAN Relationships
Inferring Physical-Host-to-Storage Relationships
Understanding Metrics
Enabling Dependency Processing
Reviewing and Editing Host-Port Assignments
Running Dependency Processing Manually
Customizing Helper Strings for Dependency Processing
Reviewing Inferred Hosts
Modifying Data Collection Schedules
Understanding Data Collection Types and Schedules
Modifying Data Collection Schedules for Storage Collector Agents
Managing Foglight for Storage Management Rules
Managing Alarm Settings
Troubleshooting Database Limits
Units of Measurement
Performance Metrics
Appendix: Collection Target Support Matrix
Online-Only Topics
Fabrics and FC Switches — Performance Metrics
Storage Arrays and Filers — Disk I/O Performance Metrics
Clustered Storage Arrays — Network Performance Metrics
Capacity Metrics
Storage Arrays — Array, Member, and Pool Capacity Metrics
Filers — Filer and Aggregate Capacity Metrics
Storage Arrays and Filers — LUN, NASVolume, and Disk Capacity Metrics
Overview of Metrics in Foglight for Storage Management
Exploring a Cisco VSAN
|
1 |
On the navigation panel, under Dashboards, click Storage & SAN > Storage Explorer. |
|
2 |
On the navigation panel, under Topology, expand Fabrics, expand a Cisco fabric with VSANs, and select a VSAN. |
|
3 |
If the Alarm Count displays alarms, you may want to assess the alarms before continuing with this walkthrough. Click a status count to open a list of device and component alarms. For more information, see Assessing Storage Alarms. |
|
4 |
In the Summary tab, review performance in terms of key metrics. |
The Summary tab contains the same Related Inventory view and Resource Utilization charts as the VSAN Summary quick view.
|
5 |
Click the ISL Ports tab. |
Displays the same information as the ISL Ports tab on the Fabric dashboard, but the data reflects only the ports that are part of the selected VSAN.
|
6 |
Click the N Ports tab. |
Displays the same information as the N Ports tab on the Fabric dashboard, but the data reflects only the ports that are part of the selected VSAN.
Exploring a Filer
Foglight for Storage Management supports NetApp filers. NetApp uses the word aggregate instead of pool, but the metrics collected for aggregates and pools are similar. In some filer views, in particular the views on the LUNs tab and Disks tabs, the word pool may be displayed instead of aggregate, but in this context it refers to aggregates.
|
1 |
On the navigation panel, under Dashboards, click Storage & SAN > Storage Explorer. |
|
2 |
On the navigation panel, under Topology, expand Filers and select a filer. |
|
3 |
In the Summary tab, review performance in terms of key metrics. |
The Summary tab contains the same views as the Filer Summary (Selected Filer) quick view described in Monitoring Filers. In addition, the tab includes the following views:
|
• |
Summary and Resource Information. Displays physical details about the filer. |
|
• |
Alarm Summary. Displays alarms on the filer. |
|
4 |
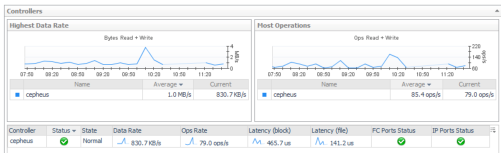
Click the Controllers-Ports tab. |
|
• |
Controllers. The charts display the controllers with the highest average Data Rate and Ops Rate. The table displays current values for each of the charted metrics, plus Latency by block and file and the most severe alarm status on the FC ports and IP ports associated with this controller. |
|
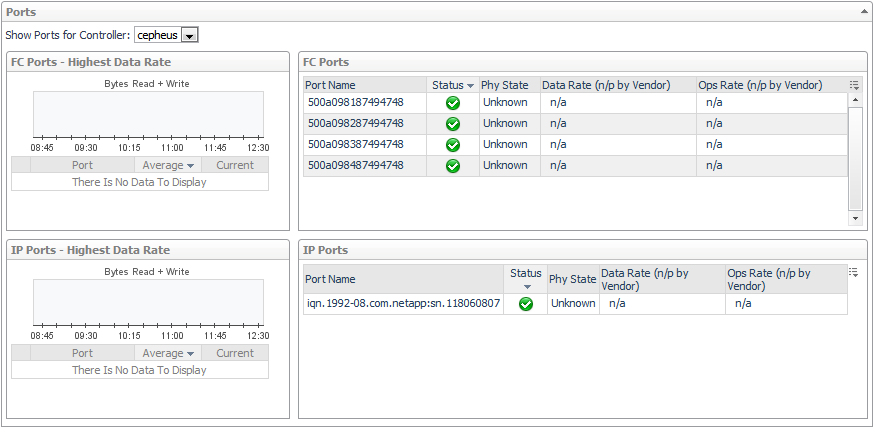
• |
Ports. Select a controller from the Show Ports for Controller list. The ports associated with the selected controller are displayed, however the port’s physical state and performance metrics are unavailable for NetApp filers. The IP ports shown are used for iSCSI I/O to LUNs traffic. |
|
• |
Alarm Summary. Displays alarms on controllers and ports. |
|
6 |
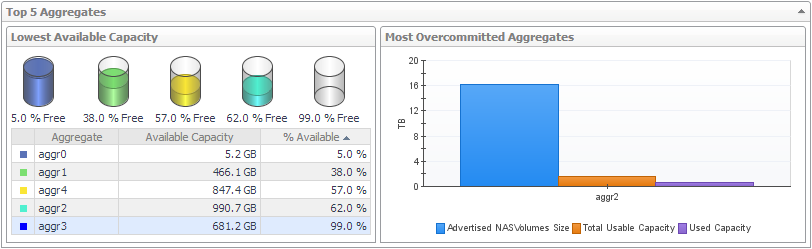
Click the Aggregates tab. |
|
• |
Lowest Available Capacity. Displays the five aggregates with the lowest average value for Available Usable Capacity over the time period. |
|
• |
Most Overcommitted Aggregates. Identifies up to five of the most overcommitted aggregates, and displays current values for Advertised NASVolumes Size, Total Usable Capacity, and Used Capacity. |
|
• |
Aggregate Details. For each aggregate, displays the aggregate name, status, and current values for Total Usable Capacity, Available Usable Capacity, % Available, Advertised NASVolumes Size, and Overcommitment. |
|
• |
Alarm Summary. Displays alarms on aggregates. |
|
7 |
Click the NASVolumes tab. |
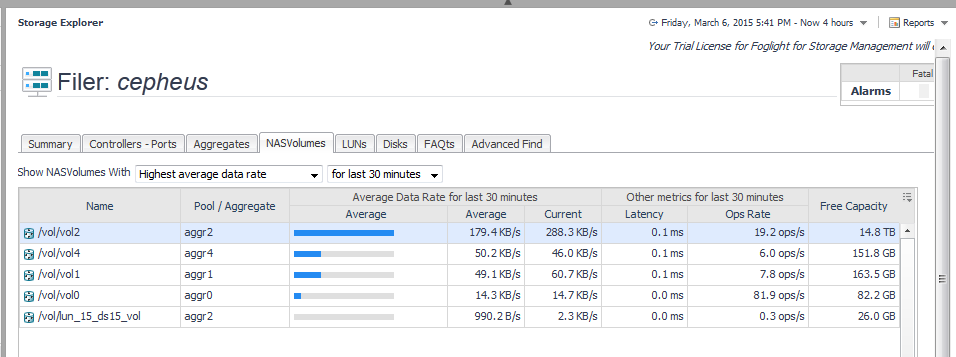
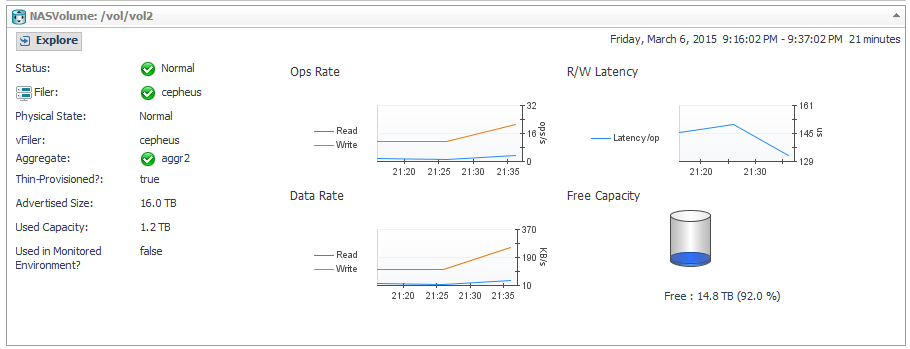
To further investigate the selected item, click Explore in the details panel. See Investigating a NASVolume.
Exploring a Storage Array
The tabs displayed on the dashboard differ depending on the selected storage array:
|
• |
Non-Clustered Storage Arrays (supported storage arrays except EqualLogic and Isilon) |
Non-Clustered Storage Arrays
Most supported storage arrays are displayed as described in this walkthrough. If you are using Dell EqualLogic arrays, EMC Isilon arrays, or EMC VPLEX arrays, see Dell EqualLogic Storage Array, EMC Isilon Storage Array, or EMC VPLEX Storage Array instead.
|
1 |
On the navigation panel, under Dashboards, click Storage & SAN > Storage Explorer. |
|
2 |
On the navigation panel, under Topology, expand Storage Arrays and select a storage array. |
|
3 |
If the Alarm Count displays alarms, you may want to assess the alarms before continuing with this walkthrough. Click a status count to open a list of device and component alarms. For more information, see Assessing Storage Alarms. |
|
4 |
In the Summary tab, review performance in terms of key metrics. |
The Summary tab contains the same views as the Storage Array Summary (Selected Storage Array) quick view described in Monitoring Storage Arrays. In addition, the tab includes the following views:
|
• |
Summary and Resource Information. Displays physical details about the storage array. |
|
• |
Alarm Summary. Displays alarms on the storage array. |
|
5 |
Click the Controllers-Ports tab. |
|
• |
Controllers. The charts display the controllers with the highest average Data Rate, Ops Rate, and % Busy, if available. The table displays current values for each of the charted metrics, plus Latency if available, and the most severe alarm status on the FC ports and IP ports associated with this controller. |
|
• |
Ports. Select a controller from the Show Ports for Controller list. The chart will display port utilization distribution, if the array provides the operating link speed of the ports. Otherwise, the Data Rate of the 3 busiest ports will be displayed. The tables will display all available current metrics for each port. |
Alarm Summary. Displays alarms on controllers and ports.
|
6 |
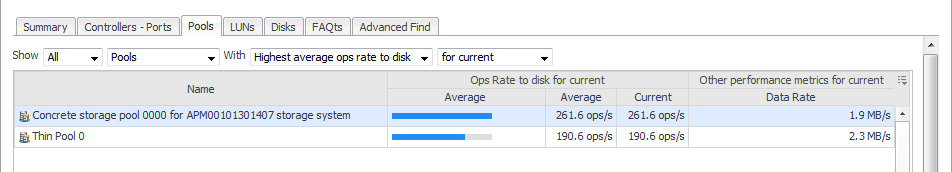
Click the Pools tab. |
|
• |
Show Top 15/All Pools/Pools w Thin LUNs With … This view lets you quickly see the top fifteen or all LUNs with a selected metric, averaged over the selected time period. The performance metrics that may be available for selection, depending on the array type, include: |
|
NOTE: Selecting Pools w Thin LUNs is useful for monitoring Pools whose available capacity can change quickly because it contains thin-provisioned LUNs. |
|
• |
Alarm Summary. Displays alarms on pools. |
|
9 |
Click the Advanced Find tab to investigate a LUN or Disk that is not included in the Top 15 items on the LUNs or Disks. Use the Advanced Find functionality to query for the desired items. For more information, see Advanced Find. |