
Adding a Server Group
You can create a Server Group to monitor metrics for up to ten Windows servers and/or clients* that are not necessarily associated with a SharePoint farm. The metrics you can monitor include:
·Servers
·SQL Servers
·Monitored Web Pages
·Resources
|
|
NOTE: For Windows clients, Resources are the only metrics that can be monitored. |

|
|
CAUTION: Note that a SharePoint node does not display in the Management Console tree for a Server Group, even if SharePoint is present. SharePoint can be monitored only via the Add Farm functionality. |

Before adding a Server Group:
All servers and/or clients in a group share common accounts for data collection. Make sure the account(s) you will be using for data collection for the group meet the data collection requirements for server performance.
To add a Server Group:
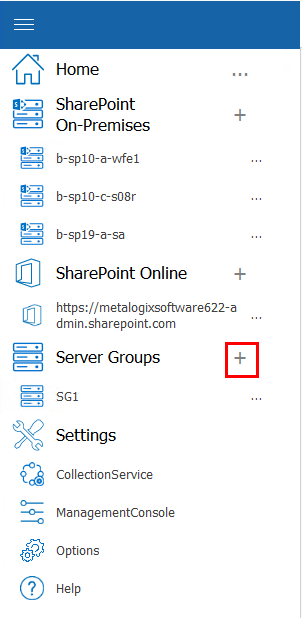
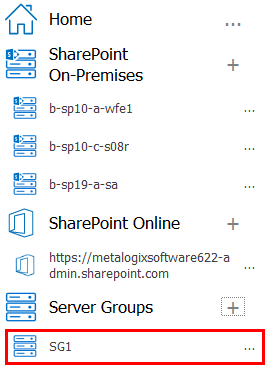
1In order to add a new server group, you must click (+) next to "Server Group" in the tree. This will open the Add Server Group Wizard.
2For Name, enter a "friendly" name for the group that you would like to have appear in the Management Console tree.
3Click Next.
4If you want to collect data using credentials other than the Collection Service Account specified when the Collection Service was installed:
a)Check the appropriate option(s):
§Gather server performance data using WMI
§Query databases for SQL Server information
§Test page performance and availability
b)Click Next.
For each option you selected, you will be prompted to enter credentials for the alternate account.
c)Enter the User Name and Password for an account that has the appropriate permissions.
|
|
NOTE: Remember to enter the full account name (for example, domain\user name). |
If an account fails validation, an error message displays.
You can either
§click Yes to ignore the warning and continue creating the server group with the specified account
OR
§click No to fix the issue then re-enter credentials
5.Click Next.
6For Setup Your Alerts, either Apply default or select Apply custom and select/deselect individual alerts and/or adjust the thresholds that you want to apply for the Server Group.
NOTE: If you change the Alert priority, you can sort the Priority column in the Alerts view according to relative importance.
|
|
NOTE: You can further customize alerts for individual servers within the Server Group after the Server Group has been added. |
7.Click Next.
A Summary dialog displays.
8.If you want to add servers to the group (up to a maximum of 10):
a)click Add Server.
b)In the Add Server dialog box, enter the Server name.
|
|
NOTE: You can enter a machine name, IP address, or fully qualified domain name (FQDN). |
c)Repeat substeps a) and b) for each server you want to add to the group.
9.Click Finish.
The server group now displays in the Management Console tree.
Now you can add monitored pages to the group.
Editing a Server Group
You can change the name and/or access credentials for a Server Group.
If you want to add or remove servers within the group, use the procedure for Manually Adding and Removing Servers to Monitor.
To edit a Server Group:
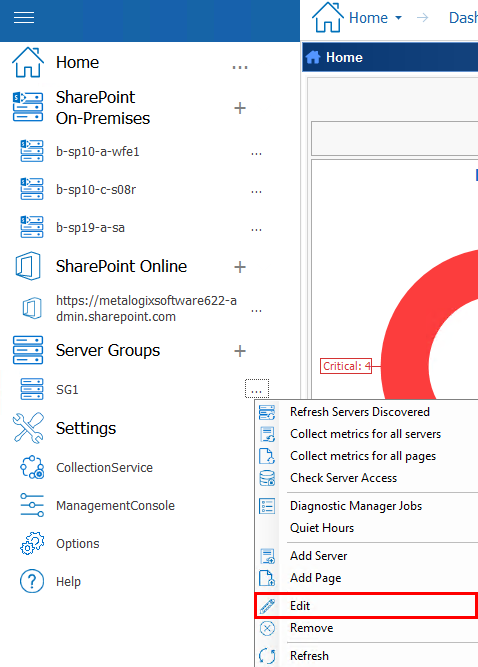
1In the Management Console tree, select the Server Group you want to edit, click (...) and then choose Edit.
2Update the appropriate fields on the Edit Server Group dialog(s). (See also Adding a Server Group.)
3Click OK.
Manually Adding and Removing Servers to Monitor
When you add a farm to Metalogix Diagnostic Manager, the Management Console automatically adds the servers that make up the farm to the Farm Server list. Periodically, the Management Console refreshes its list to keep it up to date.
You can also add servers manually that the farm depends on for information that are not part of the farm. You can also add new servers that you create or servers that are not automatically added. You can also add servers manually (up to a maximum of 10) to a Server Group.
After you manually add a server, Metalogix Diagnostic Manager does not make a distinction between it and any servers added automatically. Metalogix Diagnostic Manager uses the same credentials to access the servers that were added both manually and automatically.
A server must be available to add it manually. If the server is not available, you cannot add it.
After you add a server, you cannot change the server name or farm. You can remove the server from Metalogix Diagnostic Manager or disable it (see Temporarily Suspending Data Collection). When you delete a server, Metalogix Diagnostic Manager deletes the historical data for the server.
To add a server manually:
1.In the Management Console tree, select a farm node, server node, or Server Group.
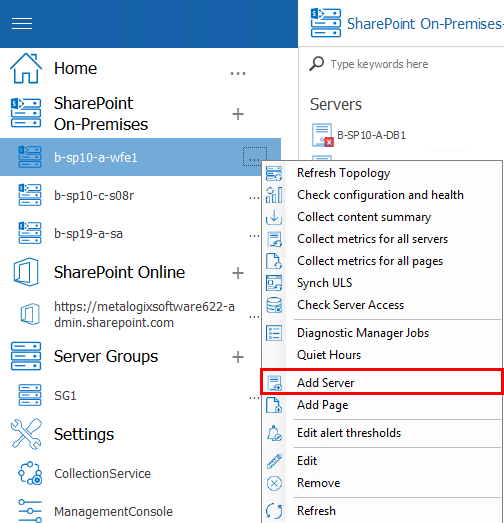
2.Select the (...) next to the farm, server, or server group, and select Add Server.
3.In the Add Server dialog box, enter the Server name.
|
|
NOTE: You can enter a machine name, IP address, or fully qualified domain name (FQDN). |
4.Click OK.
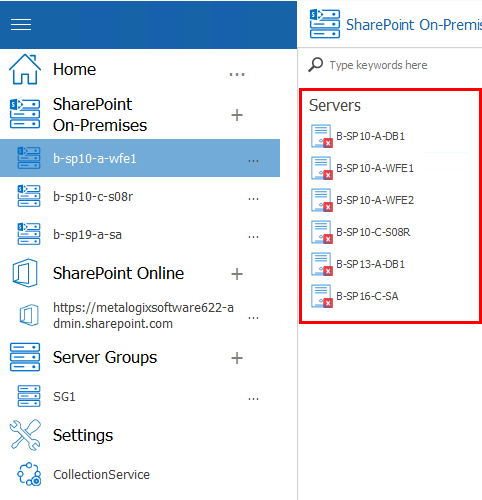
5.The server and its components are now displayed when you double click on the Farm or Server Group node, and select Servers from the top ribbon.
Note that:
·If the server you added is part of a cluster and/or SQL AlwaysOn availability group, all other servers in the cluster/availability group will be added to the Management Console automatically. In order to actually be monitored, however, these servers must also be licensed.
·If you added a Windows client to a Server Group, the only associated component is Resources.
To remove a manually-added server:
|
|
NOTE: You can only remove servers that were added manually. You cannot remove servers that Metalogix Diagnostic Manager discovers automatically. (In the case of a server that was discovered as part of a cluster or SQL AlwaysOn availability group, If you attempt to remove it, it will be re-discovered.) You can, however, disable data collection from automatically-added servers. |
In the Management Console tree, select the manually-added server that you want to remove, select the (...) next to it, and select Delete.
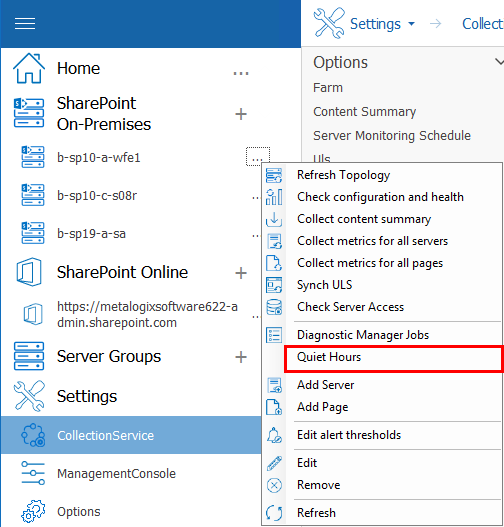
Setting Farm or Server Group "Quiet Hours"
By default, Metalogix Diagnostic Manager provides continuous, 24/7 monitoring of your SharePoint farms and any Server Group(s) you have added. You can, however choose to set regular "Quiet Hours" during which time monitoring, data collection, and alert processing is suspended for all objects modified in the farm or Server Group.
To set "Quiet Hours" for a farm or Server Group:
1In the Management Console tree, select the farm (or Server Group) for which you want to set Quiet Hours, click the (...) and select Quiet Hours.
3Check the Make Farm quiet in this time period (or Make Server Group quiet in this time period) box to enable remaining fields.
4To specify Quiet Hours:
§Select the Start time and End time for which you want monitoring, data collection, and alerts to be suspended.
|
|
NOTE: The time interval you select reflects the local time of the Management Console machine where the Quiet Hours are set. |
§Check each of the days for which you want the Quiet Hours to apply.
5When you have finished setting Quiet Hours, click OK.