Running a Full or Partial Discovery Manually
You can run a Discovery on your entire farm or a Partial Discovery on selected Web applications/site collections either interactively or on a one-time or recurring schedule.
You may want to manually run a Full Discovery when:
·the nightly Full Discovery job is disabled or has failed to run, or
·you want to perform an ad hoc update to the ControlPoint cache.
A Partial Discovery can be useful:
·when you want to update the ControlPoint cache for specific Web applications/site collections only without having to run a more resource-intensive Full Discovery. (For example, if you just granted new permissions to a user in the Business Administrators group and want sites to be visible to that user in the SharePoint Hierarchy, you can run a partial Discovery just on the Web application(s) containing the sites that the user manages.)
·for Web applications or site collections that you have excluded from the Full Discovery process. For example, some Web applications, such as those that contain My Sites, can greatly increase the Full Discovery run time. Web applications containing such sites may be excluded from the Full Discovery process and scheduled to run less frequently.
IMPORTANT: Unlike Full Discovery, which runs under the ControlPoint Service Account, manual Discovery is run under the credentials of the logged-in user. Therefore, you can only discover site collections for which you are a Site Collection Administrator.
To run a Discovery manually:
1From the Manage ControlPoint tree choose ControlPoint Management > Discovery.
2Use the information in the following table to determine the appropriate action to take.
|
If you want run a... |
Then ... |
|
Full Discovery |
do not modify the Selection section. NOTE: The default selection encompasses the entire farm, except for any Web applications and/or site collections that have been excluded from the Full Discovery process. |
|
Partial Discovery |
select the Web application(s)/site collection(s) on which you want to run Discovery, using the procedure for Changing Your Selection. NOTE: The Partial Discovery will include all Web applications/site collections that you explicitly select, regardless of whether they have been excluded from the Full Discovery process. |
3Either:
§run the Discovery immediately (by clicking the [Run Now] button).
OR
§schedule the Discovery to run on a one-time or recurring basis.
Using ControlPoint Dashboards
ControlPoint dashboards provide graphical overviews of targeted data in your SharePoint environment.
SharePoint Summary Dashboard
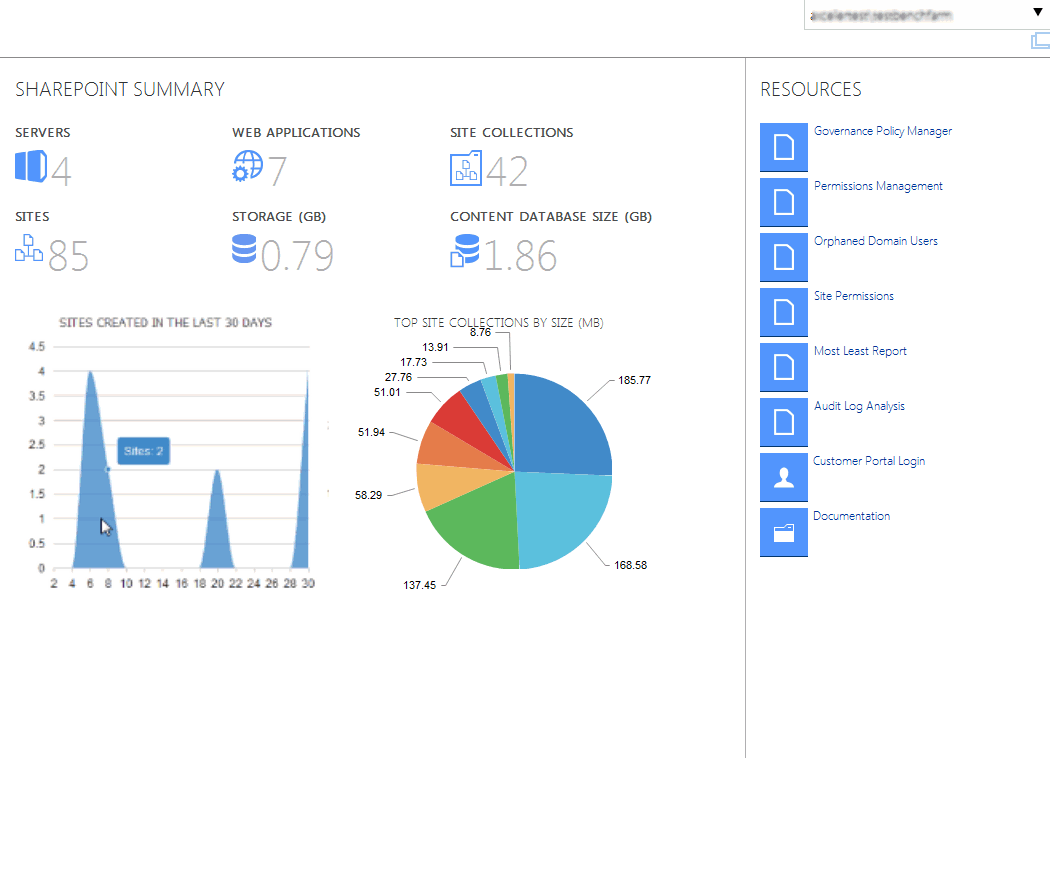
The SharePoint Summary dashboard, which is availableand displays as the home pagefor ControlPoint for SharePoint 2013 and later Standard installations, contains the following information:

·statistical information about your SharePoint farm
NOTE: This information is updated daily, when the ControlPoint application pool is restarted, typically after the ControlPoint Scheduler timer job has run. If the Scheduler timer job is disabled, data retrieval begins when the first request is made to ControlPoint.
Statistical information comes from the following sources.
|
Data |
Source |
|---|---|
|
SharePoint Summary |
If Discovery has been run, the data is taken from the ControlPoint Service (xcAdmin) database; if Discovery has not been run, the data is taken directly from SharePoint. |
|
Site Collections Created in the Last 30 Days |
The data is taken from SharePoint Search engine. NOTE: If for some reason Search engine is not configured to provide the data, the chart will not display. |
|
Top Site Collections by Size |
The data is taken from SharePoint. ControlPoint security trimming applies. That is, for each site collection to which the logged in user does not have access, the chart displays the message "Site Collection not available," but shows the size. |
·quick links to some of ControlPoint's most powerful functionality:
§the Governance Policy Manager, which allows you to define standard governance polices or best practices, then apply them to one or more site collections
NOTE: This feature is not available for SharePoint Foundation.
§the Orphaned Domain User analysis, which identifies users who currently have permissions in SharePoint but are no longer valid in the Active Directory
§The Most/Least report, which identifies SharePoint objects that have the most or least activity, use the most or least storage, or have the most or least amount of content.
§the Permissions Management tool, which lets you perform a variety of ControlPoint permissions actions and analyses within a self-contained interface (details of which can be found in the ControlPoint Permissions Management for Site Admins Guide)
·links to Quest Support as well as ControlPoint user documentation on the Quest website.
If a ControlPoint operation is launched from the dashboard, you must select the object(s) on which to perform the operation using the Change Selection option.
To access the SharePoint Summary dashboard:
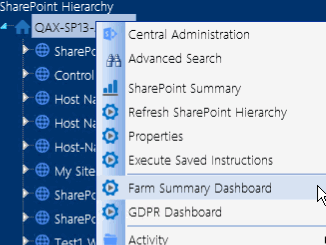
As well as being the default home page, you can invoke the SharePoint Summary dashboard from the SharePoint Hierarchy farm node, by choosing Farm Summary Dashboard.
NOTE: This option is not available for SharePoint 2010 farms or ControlPoint Non-Standard installations.
GDPR Dashboard
If your organization is subject to General Data Protection Regulation (GDPR) compliance, the GDPR dashboard provides an overview of how your organization is using ControlPoint to manage regulation-sensitive areas of your SharePoint environment.
GDPR dashboard statistics are populated based on usage of the following functionality:
·SharePoint Audit Settings
To access the GDPR dashboard:
From SharePoint Hierarchy farm node, choose GDPR Dashboard.
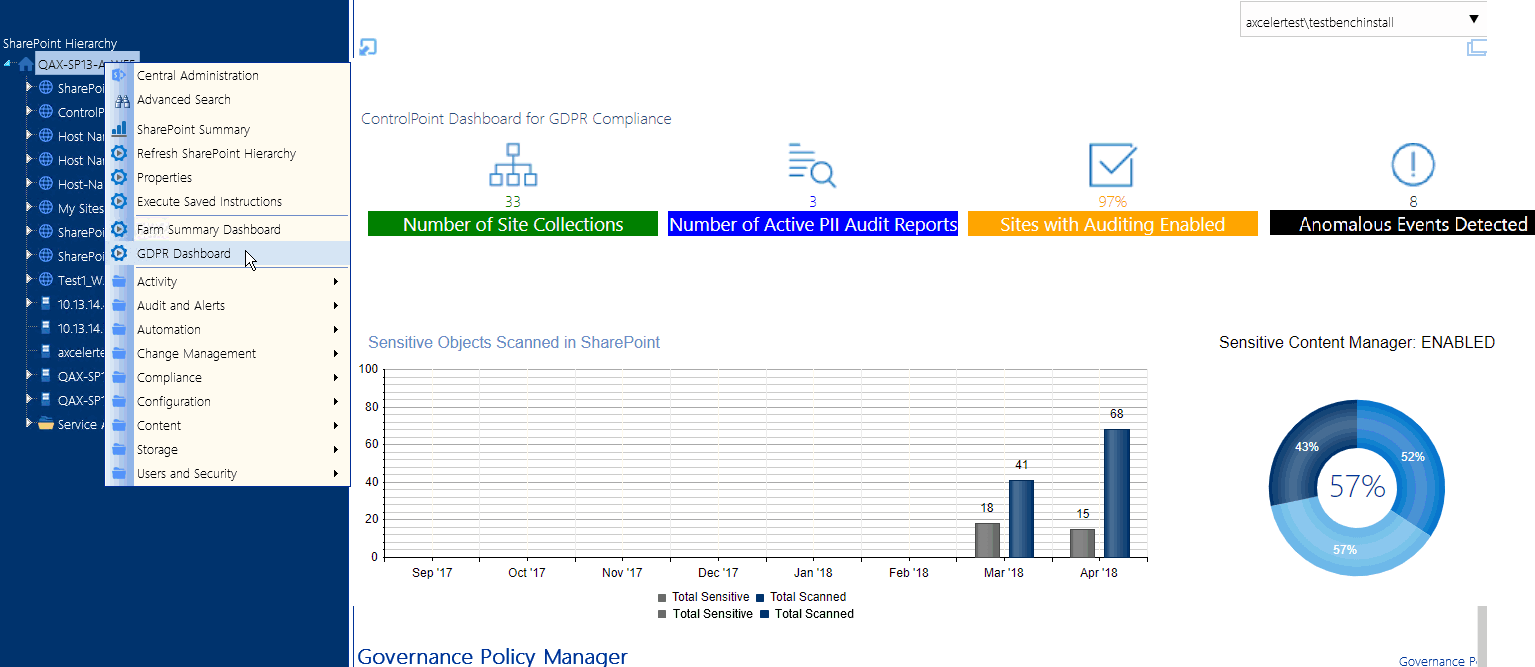
The GDPR Dashboard displays the following information:
·the Number of Site Collections in your farm (excluding Central Administration) as of the last Full Discovery run.
·If your organization uses Sensitive Content Manager:
§Number of Active PII Audit Reports represents the number of Sensitive Content Manager jobs scheduled to be scanned and ControlPoint policies created to scan documents.
§Sensitive Objects Scanned in SharePoint shows the number of documents determined to contain sensitive content compared to all items scanned within a given month.
§the Sensitive Content Manager: ENABLED donut graph shows the following percentages:
oThe light blue section represents the percentage of site collections containing content for which at least one scan has been performed PLUS site collections that have at least one Active PII Audit Report.
NOTE: This percentage is also the number that displays inside the donut graph.
oThe medium blue section represents the percentage of site collections containing content for which at least one scan has been performed.
othe dark blue section represents site collections that have had no Sensitive Content Manager activity.
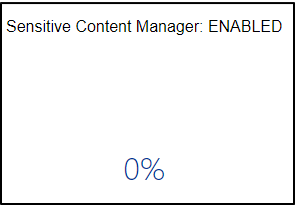
If you have never used Sensitive Content Manager, this section will always display 0%.
·If your organization uses ControlPoint Sentinel, Anomalous Events Detected represents the number of deviations in document views and downloads from individual users' "typical" daily usage patterns
·Sites with Auditing Enabled represents the percentage of site collections within your SharePoint farm for which all audit settings are enabled.
NOTE: If any of the site collection audit settings are not enabled or if audit settings are enabled at the site level or below (which is possible if you are using ControlPoint Manage Audit Settings functionality), the site collection will not be counted in this percentage.
·If your organization uses ControlPoint Governance Policy Manager, the bottom section lists all of the Governance Policies that currently exist for the farm.


