立即与支持人员聊天
与支持团队交流

Foglight for Application Operations 5.9.8.5 - User Guide

Introducing Foglight APM Monitoring Transactions Examining Response Times Examining Error Breakdowns Viewing Real User Activity from a Geographical Perspective Using the SOC Transactions Tab Using the SOC for APM triage Creating Custom Drag-and-Drop Dashboards APM Tile and View Reference Appendix: Enabling End User Transactions from FxM and FxV

Topology object name reference table

The following table provides the domain and topology object names you need to use to ensure the tiles appear correctly for a manually built service.

.NET

.NETApplicationInstance

Apache

ApacheSvrAgent

AppMonitor

AppMonitorAgent

APM Appliance (hits)

EUHitInteraction

APM Appliance (sequences)

EUSequenceInteraction

Custom Application Transactions (Java EE and .NET®)

CustomApplicationTransaction

DB2

DB2_Instance

FTR

FTRResult

FxM

FxMApplicationResult

Host1

Host

Java EE Technologies

JavaEEAppServer

JMX

JMXServer

Log Filter

LogFilterAgent

MQ Series

MQQueueManager

Oracle

DBO_Instance

SQL Server

DBSS_Instance

Sybase

Sybase_MDAAgent

WebMonitor

WebMonitorAgent


1

For hosts, always select the host object, regardless of whether or not the host is virtual (for example, Hyper-V® or VMware®). Foglight looks for the appropriate host extensions and displays the associated host dashboard (physical or virtual).


Appendix: Enabling End User Transactions from FxM and FxV

This section describes the configuration required to use FxM and FxV as data sources for Foglight for Application Operations. Read through all sections that apply to the functionality you want to enable before attempting to configure the integration and use the dashboards.

For building services:

For the Service Operations Console (SOC):

For Geographical Perspectives:

For Response Time Breakdowns:

Understanding recommended service structures

In Foglight, a service is any component or group of components that you want to monitor. If you have the Advanced Operator role, you can create services in the Service Builder dashboard to reflect the components in your monitored environment that are meaningful or interesting to your organization. For more information, see the topic “Monitoring your services” in the Foglight User Guide.

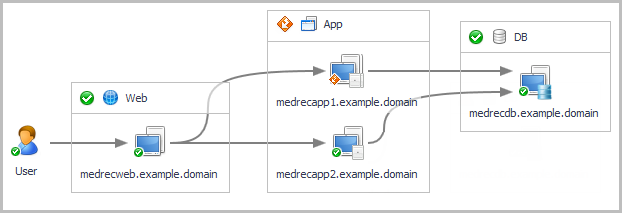
APM users typically organize their application services into three types: a Top Level Service, Tier Services, and one or more User Services. Each logical tier in the application should have its own service, which includes the application components (for example, databases, application servers, web servers) and the hosts that support those components.

For example, a typical small web application might have the following service structure.

This is a high-level, or tier view of the service structure. This service includes four tiers: User, Web, Application, and Database.

This service can also be represented as follows.

This is the application infrastructure view. Here you can see the hosts contained in each tier: an Apache server (web tier), two instances of WebLogic® each hosted on a separate application server (App tier), and an Oracle® database instance (DB tier).

For more information, see the following topics:

Service Level Agreements in Foglight APM

Foglight automatically examines each service and establishes its availability and service level compliance. By default, a service is available and compliant with its Service Level Agreement (SLA) if it does not have any fatal alarms.

The following general guidelines are recommended for Foglight APM:

相关文档

The document was helpful.

选择评级

I easily found the information I needed.

选择评级