Server - Apache Monitor tile
The Apache Monitor Tile summarizes the performance of an Apache server. Use this tile to gather performance information about the state of Apache server transactions.
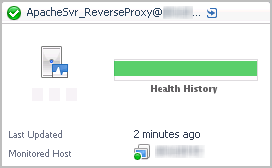
Topology Object Name: ApacheSvrAgent
|
|
|
• |
Alarms. A count of fatal, critical, and warning alarms on the host system. | |
|
|
|
• |
Health History Bar. The color-coded bar represents the alarm state of the monitored component over the time range selected in the SOC. The color of the bar changes depending on the alarm state. Red indicates a Fatal state, orange indicates Critical, yellow means Warning, and green is the Normal state. | |
|
|
|
• |
Last Updated. The amount of time, in minutes, since the host information was last updated. | |
|
|
|
• |
Monitored Host. The name of the monitored host, and an icon representing the type of host. | |
Application Monitor tile
The Application Monitor Tile summarizes the performance of an application server. Use this tile to gather performance information about the state of server transactions.
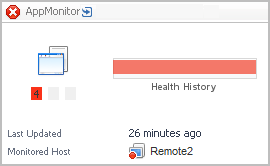
Topology Object Name: AppMonitorAgent
|
|
|
• |
Alarms. A count of fatal, critical, and warning alarms on the host system. | |
|
|
|
• |
Health History Bar. The color-coded bar represents the alarm state of the monitored component over the time range selected in the SOC. The color of the bar changes depending on the alarm state. Red indicates a Fatal state, orange indicates Critical, yellow means Warning, and green is the Normal state. | |
|
|
|
• |
Last Updated. The amount of time, in minutes, since the host information was updated. | |
|
|
|
• |
Monitored Host. The name of the monitored host, and an icon representing the type of host. | |
Log Filter tile
The Log Filter Tile summarizes the performance of an Alarm Filter agent. Use this tile to gather performance information about the state of log filter transactions.
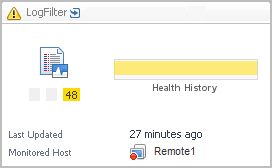
Topology Object Name: LogFilterAgent
|
|
|
• |
Alarms. A count of fatal, critical, and warning alarms on the host system. | |
|
|
|
• |
Health History Bar. The color-coded bar represents the alarm state of the monitored component over the time range selected in the SOC. The color of the bar changes depending on the alarm state. Red indicates a Fatal state, orange indicates Critical, yellow means Warning, and green is the Normal state. | |
|
|
|
• |
Last Updated. The amount of time, in minutes, since the host information was last updated. | |
|
|
|
• |
Monitored Host. The name of the monitored host, and an icon representing the type of host. | |
Web Monitor tile
The Web Monitor Tile summarizes the performance of a web server. Use this tile to gather performance information about the state of server transactions.
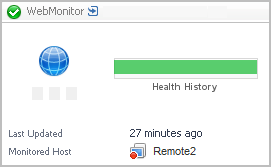
Topology Object Name: WebMonitorAgent
|
|
|
• |
Alarms. A count of fatal, critical, and warning alarms on the host system. | |
|
|
|
• |
Health History Bar. The color-coded bar represents the alarm state of the monitored component over the time range selected in the SOC. The color of the bar changes depending on the alarm state. Red indicates a Fatal state, orange indicates Critical, yellow means Warning, and green is the Normal state. | |
|
|
|
• |
Last Updated. The amount of time, in minutes, since the host information was last updated. | |
|
|
|
• |
Monitored Host. The name of the monitored host, and an icon representing the type of host. | |
