立即与支持人员聊天
与支持团队交流

Foglight Automation 7.3.0 - User and Reference Guide

Summary View

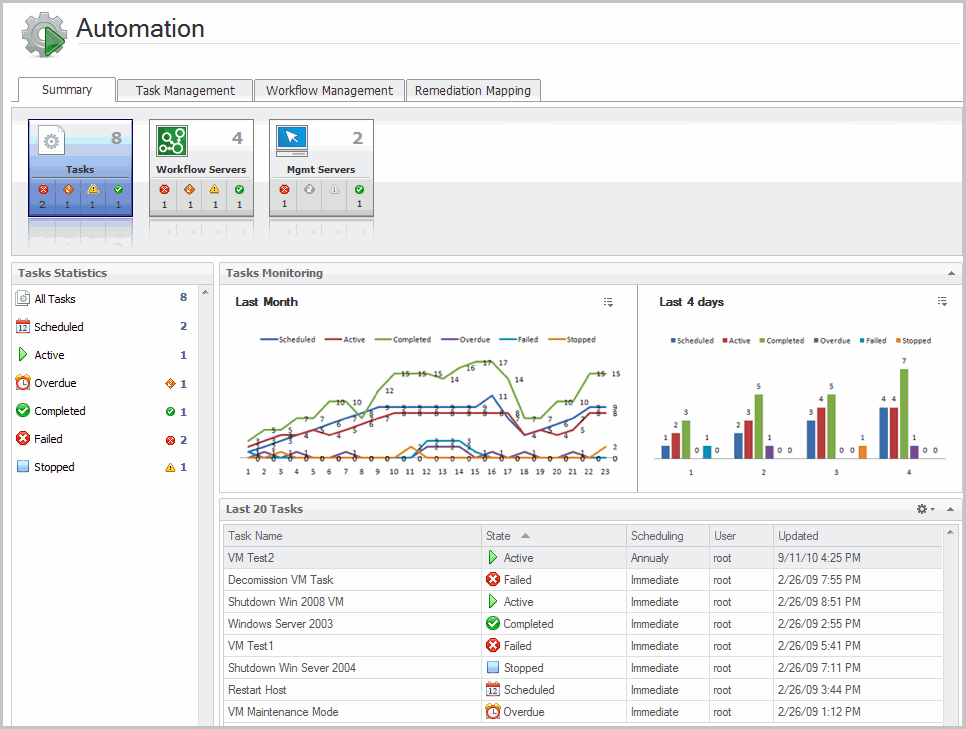
The Summary tab provides general information about the Automation resources and processes, and allows you to:

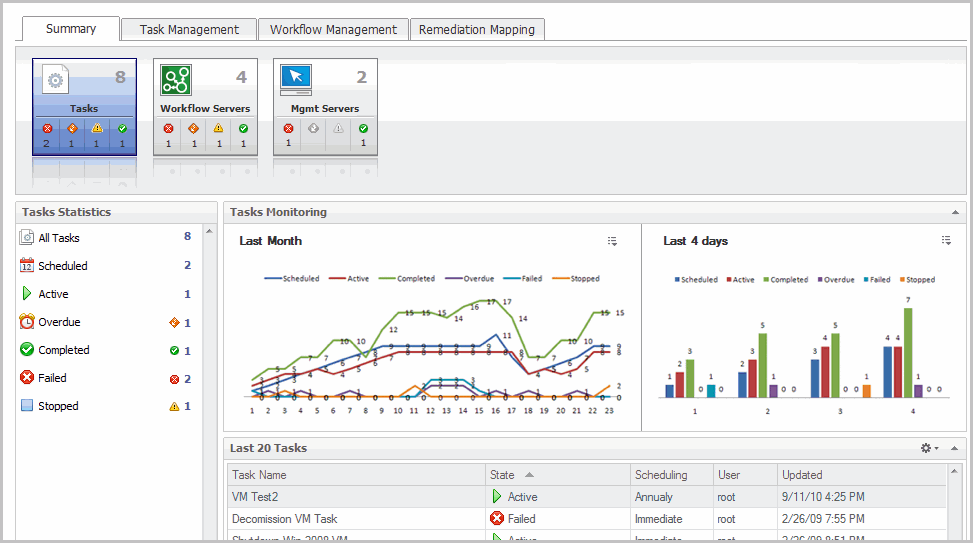
The Summary tab contains three tiles:

Viewing the Tasks Summary

The Tasks Summary contains two view: Task Statistics and Task Monitoring. The Tasks Statistics view lists task categories. To view the tasks for a particular category, click the category in the list. The summary information about the tasks of the selected category appears in the Tasks Monitoring view. You can see the task execution statistics for either the last month or the last 4 hours.

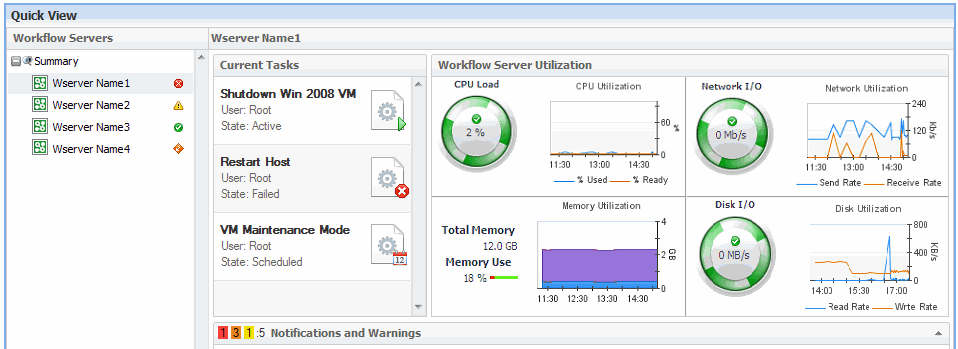
Viewing the Workflow Servers Summary

On the Summary tab, click the Workflow Servers tile.

The Workflow Servers Summary contains two views: Workflow Servers and Summary. The Summary view on the right changes depending on the selection in the Workflow Servers list on the left. Select a workflow server from the list to view its utilization statistics in the Details view.

To view detailed information about an alarm, error, related host, or related agent, hover the cursor over its icon. A dwell appears, containing detailed information about the selected entity.

Viewing the Management Servers Summary

On the Summary tab, click the Management Servers tile.

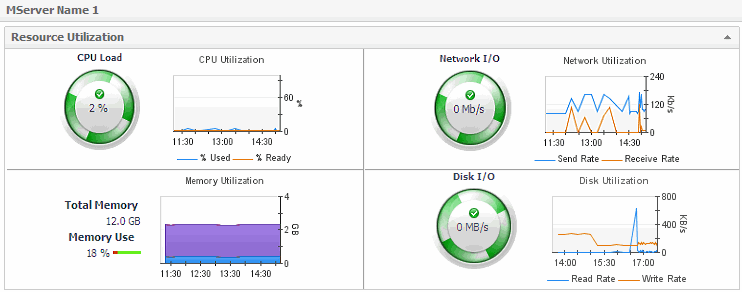
The Management Servers view displays statistical information about server resource utilization, while alarms and system changes appear in the Summary view.

Select a management server from the list to view its operational status. The Resource Utilization view displays information about the following parameters of the selected management server:

To view detailed information about an alarm, error, related host, or related agent, hover the cursor over its icon. A dwell appears, containing detailed information about the selected entity.

相关文档

The document was helpful.

选择评级

I easily found the information I needed.

选择评级