立即与支持人员聊天
与支持团队交流

Foglight for Sybase 7.1.0 - User and Reference Guide

Using Foglight for SAP ASE
Exploring the SAP ASE Dashboards About the Sybase_MDA Agent About the Sybase_RS Agent Generating SybaseMDA Reports
Reference

Top Users Tab

This tab covers the same users listed in the Current Top Sessions Tab.

The difference are:

The users shown in this table are determined by the values set for the following Sybase_MDA agent properties:

For more information, see Setting Data Retrieval Properties .

Top user information is provided in two tables:

This table has the same columns as the Top SQL Table. The only difference is that the SQL Text table provides data for selected user-executed SQL statements.

Current Top Sessions Tab

Current top session information is provided in three tables:

You can filter the Current Top Sessions according to the Wait Classes, by clicking Choose Resource. Then select a resource from the list of the Wait Classes for events that occurred in the time period. This allows you to view only those processes for which that specific Wait Class occurred. The possible wait classes are:

The Top Sessions table lists all of the top sessions.

The filters appearing just above the table allows you to look for specific entry based on some known criteria. You can filter on:

Time range, by selecting Since Logon, Last Sample, or Last 10 min

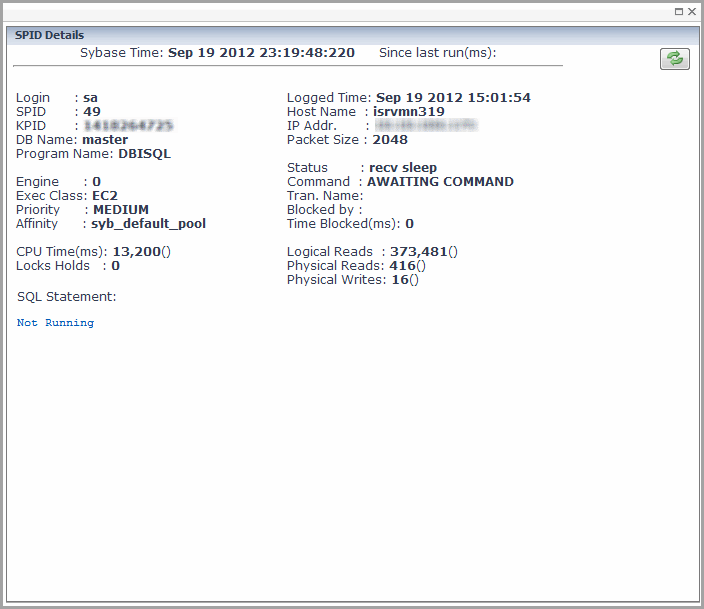
Click the Login Name for a session to view a popup that provides real-time monitoring details about the associated process.

Figure 18. SPID Details

These details include the time (in milliseconds) that has elapsed since the process was last run. Values for other statistics since the process was last run are provided in brackets.

Select an option button on the Top Sessions table to specify the SPID (session process identifier) number.

Option button

Shows additional information about the selected SPID in the Top SQL of Session with SPID Table and Wait Events of SPID xx for Period Table.

Login Name

The login name used to open the SAP ASE session.

SPID

The Session Process Identifier (SPID) number.

Block by

If there is a block, this column shows the blocking process ID in red.

Database Name

The name of the database for which execution statistics are being monitored.

Application

The name of the application for which execution statistics are being monitored.

CPU Time since Logon (ms)

The CPU time (in milliseconds) used by the session since the user logon.

Wait Time (ms) Since Logon

The wait time (in milliseconds) since the logon.

Logical Reads Since Logon

The number of buffers read from cache since the logon.

Physical Reads Since Logon

The number of buffers read from disk since the logon.

Physical Writes Since Logon

The number of buffers written to disk since the logon.

Current SQL

The SQL statement currently being executed by this session.

Command

The command code for the last SQL statement executed by this session.

Table Pages Accessed Since Logon

The number of table pages accessed since the logon.

Index Pages Accessed Since Logon

The number of index pages accessed since the logon.

Locks Currently Held

The number of locks the process currently holds.

TempDB pages Currently Used

The number of temporary database pages the process is currently using.

Commits Since Logon

The number of database commits since the logon.

Rollbacks Since Logon

The number of database rollbacks since the logon.

Engine

The number of the engine on which the process is running.

The Top SQL of Session with SPID (session process identifier) table has the same columns as the Top SQL tab, Top SQL Table.

This table provides detail for the top SQL session selected in the Top Sessions Table.

This table provides detail for SPID xx for the time period. The SPID number is selected in the Top Sessions Table.

SQL Details Tab

The SQL statement details are provided in a table.

You can display the SQL details for specified SQL text using the Filter on SQL Text box and clicking Apply. You can view the full list by clicking Show All.

Figure 19. SQL Details Tab

Blocked Tree Tab

The Blocked tree tab shows the:

The blocked tree information is provided in the Blocked Tree Table. You can select the time for the metrics displayed:

Figure 20. Blocked Tree Tab


相关文档
Foglight for Sybase - 7.1.0
Release Notes
User and Reference Guide
Showing 1 to 2 of 2 rows

The document was helpful.

选择评级

I easily found the information I needed.

选择评级