Resource Pools Relationship Tree view
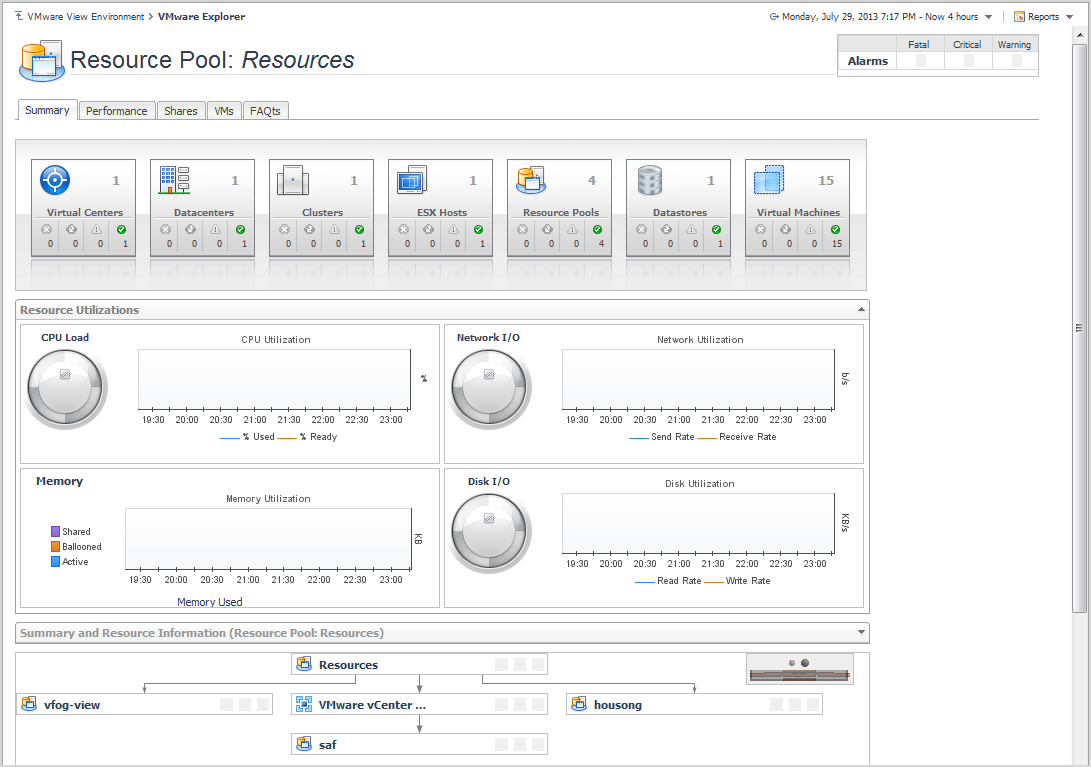
The Resource Pools Relationship Tree view is provided in the VMware Explorer dashboard. If you select a Resource Pool container from the Topology view on the Virtual Infrastructure view and click the Summary navigation tab within the VMware Explorer Primary view, a Resource Pools Relationship Tree view is displayed in the Primary view. A Resource Pools Relationship Tree contains every resource pool that belongs to the clusters within the associated VirtualCenter.
For more information about the VMware Explorer dashboard, see VMware Explorer View .
The Resource Pools Relationship Tree view is useful if you want to see how the resource pools within the clusters are laid out or if you want to take a look at the utilization statistics for each configured resource pool on the VirtualCenter.

The default Resource Pools Relationship Tree simply displays the names of the various resource pools and their parent/child relationships.
You can use the Normal Zoom Level button on the mini map at the top right of the Relationship Tree to zoom into a more detailed version of the Tree. You can use the Minimized Zoom Level button on the mini map to zoom back out again.
You can browse through a Relationship Tree by clicking and dragging the rectangular shadow provided on the mini map.
Shares tab
This tab is available in the VMware Explorer. To find it, open the VMware Explorer and on the Virtual Infrastructure view, that appears on the navigation panel, select a cluster, ESX® host, or resource pool instance. In the VMware Explorer, open the Shares tab.
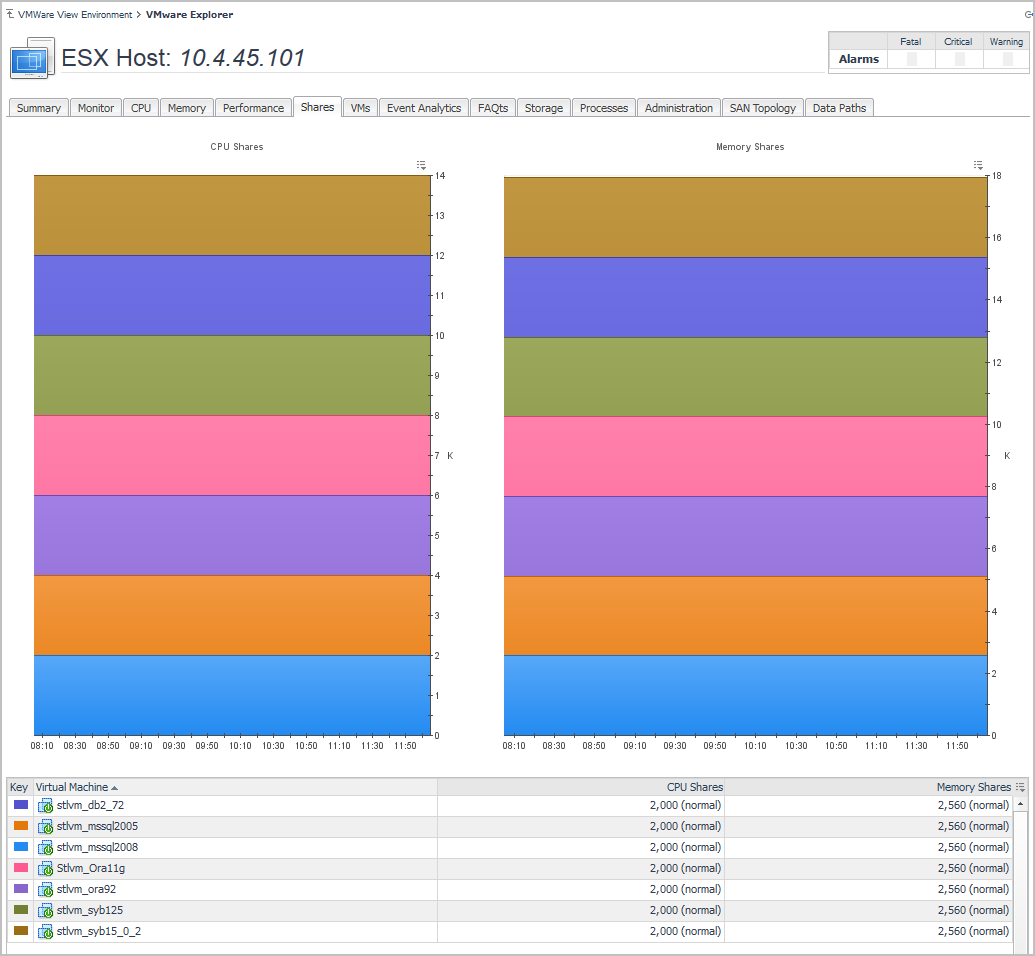
The VMware Explorer’s Shares tab displays the CPU and memory shares that are in use by the virtual machines associated with the selected component.

This view is made up of the following embedded views:
This view shows the CPU shares that are in use by the virtual machines associated with the selected cluster, ESX host, or resource pool instance.
This view shows the memory shares that are in use by the virtual machines associated with the selected cluster, ESX host, or resource pool instance.
This view shows a list of all virtual machines that are associated with the selected cluster, ESX host, or resource pool instance. For each virtual machine, it displays its name along with a color indicator for displaying this information in the Active Memory and Shared Memory views. The list also shows the numbers of CPU and memory shares used by each virtual machine.
Storage tab
This tab is available in the VMware Explorer. To find it, open the VMware Explorer and on the Virtual Infrastructure view, that appears on the navigation panel, select a Virtual Center, Datacenter, Cluster, ESX® host, or virtual machine instance. In the VMware Explorer, open the Storage tab.
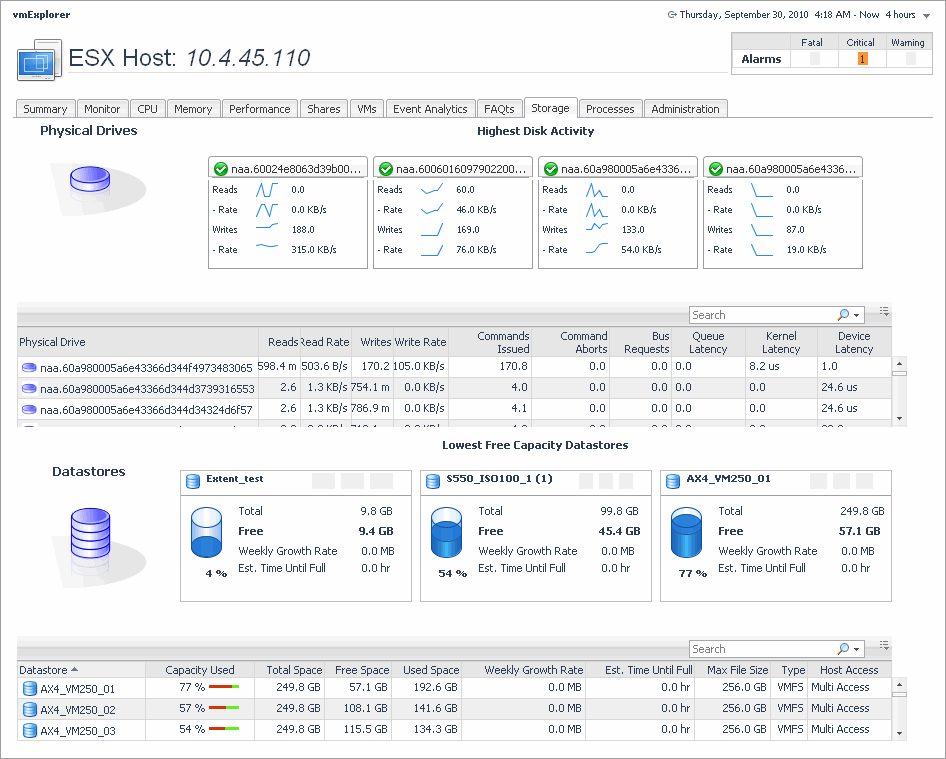
The VMware Explorer Storage tab displays combination of embedded views organized into physical drive and logical disk sections. It identifies the physical drives with the highest disk activity, and the logical drives with the lowest capacity. It also lists all physical drives for the selected server, their read and write rates, along with the logical drives, the space used on each and shows data growth patterns and the related estimates.

This view is made up of the following embedded views:
This view contains information about the used, free, and total space of the selected components’s datastores, along with projected short-term estimates, given the current growth patterns. It also identifies the datastores that have the lowest percentage of free space. For each identified datastore, it shows the total amount of datastore space, including used and free space, free space, weekly growth rate, the current percentage of the used disk space, and the estimated time after which the datastore will be full.
This view contains information about the used, free, and total space of the selected virtual machine’s logical disks, along with projected short-term estimates, given the current growth patterns. It also identifies the logical disks that have the lowest percentage of free disk space. For each identified disk, it shows the total amount of disk space, including used and free space, free disk space, weekly growth rate, the current percentage of the used disk space, and the estimated time after which the disk will be full.
This view contains information about the read and write activities that take place on the physical drives of the selected component. It identifies the physical drives that have the highest amount of disk activity. For each identified drive, it shows the number of reads and writes, along with their read and write rates. It also contains a list of all physical drives that shows the numbers or read and write requests, and the rate at which the data is read from to or written to the selected drive, all during a selected time period.
Summary tab
The Summary tab is provided as part of the VMware Explorer dashboard Primary view. You can open this tab from the top of the VMware Explorer Primary view. For more information about the VMware Explorer dashboard, see Use the VMware Explorer .
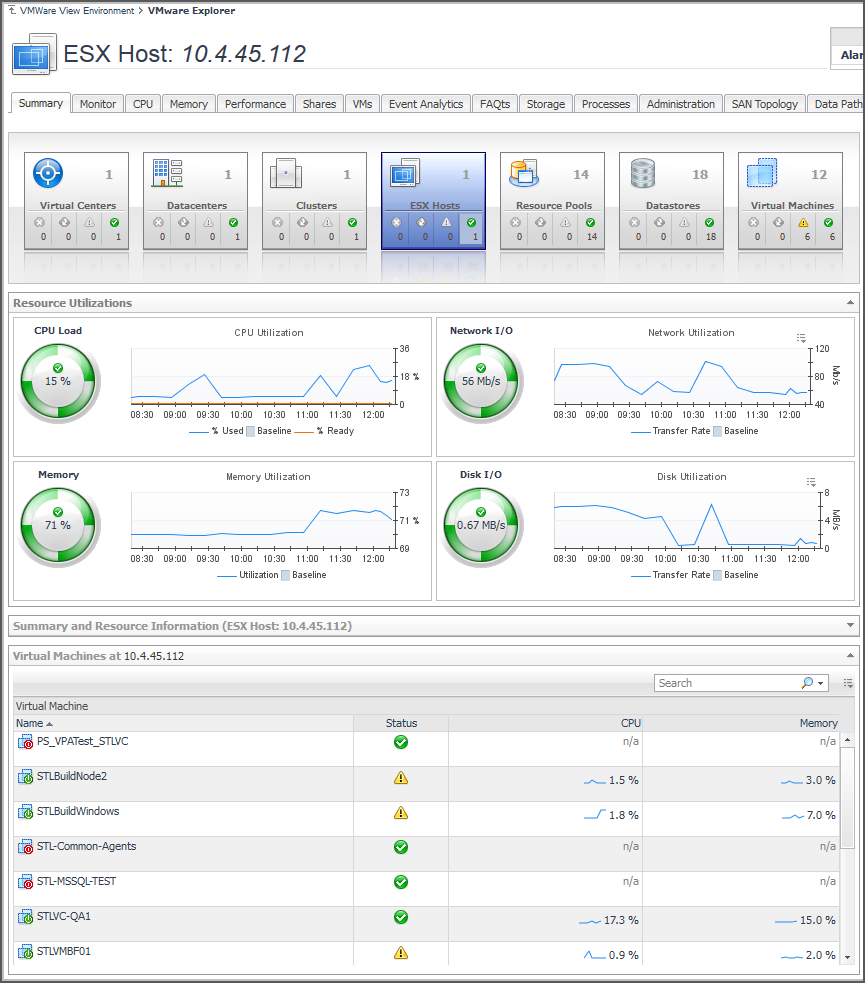
The Summary tab provides a hierarchical inventory, in the form of tiles, of the objects that are related to the object or group of objects selected.

Each tile shows how many of the corresponding object type there are, as well as the count of objects of that type in each of the alarm states (normal, warning, critical, fatal).
More detailed information for the selected object or objects is displayed in the collapsible views below the Summary tab.
On a tile, click the object type icon, the object type name, or the object count, to view a popup that lists all objects of the corresponding type, along with their respective states. Click a column header on the popup to change the sort order. Click an object in the popup list to view details for that object in the VMware Explorer dashboard.
On a tile, click an alarm state icon or the number below it to view a popup that shows the outstanding alarms of that state for the corresponding object type.
If an alarm state has a count of zero, then you can not select that alarm state. When you click a normal state icon or count, the VMware Explorer page is refreshed, but you do not see an alarms popup because there are no alarms associated with the normal state.