|
1 |
On the Storage Environment dashboard, ensure the Monitoring tab is selected. |
|
2 |
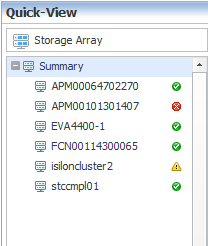
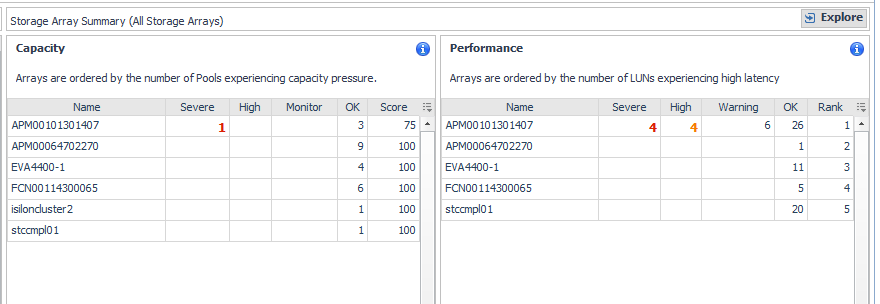
Click the Storage Arrays tile to open the Storage Arrays quick view. |
|
3 |
|
• |
|
• |
|
• |
|
• |
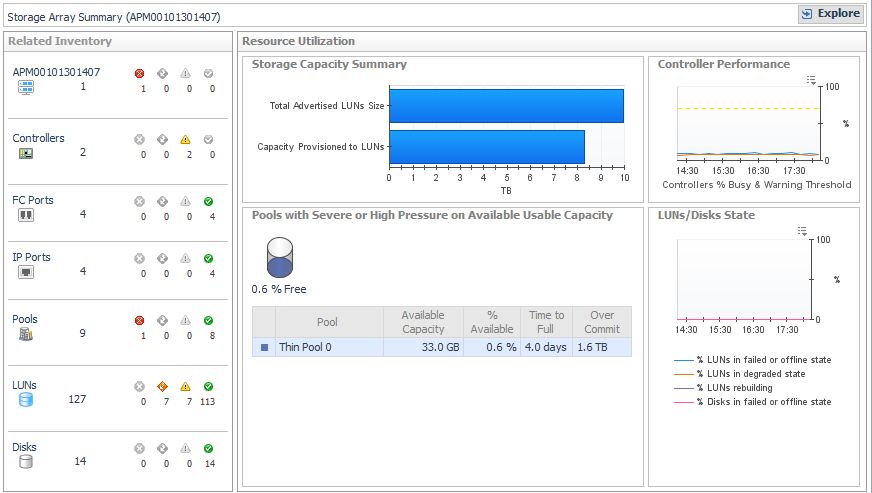
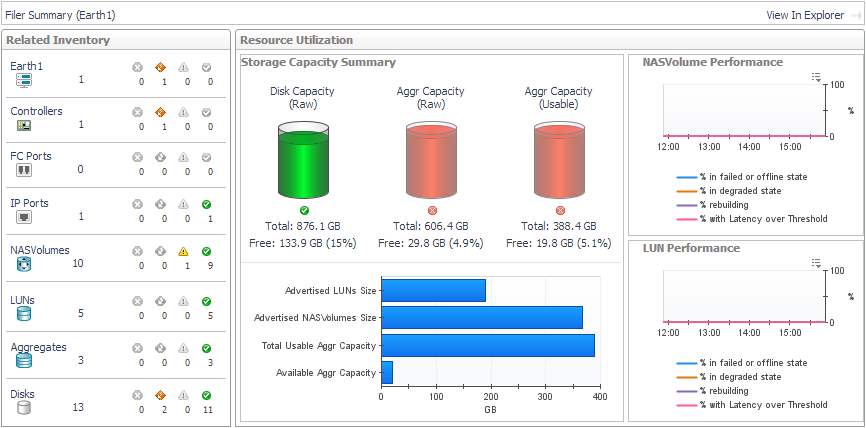
Related Inventory. Contains alarm summaries for the selected storage array and its controllers, FC ports, IP ports, pools, LUNs, and disks. |
|
• |
Storage Capacity Summary. Displays current values for Total Advertised LUNs Size and Capacity Provisioned to LUNs. |
|
• |
Controller Performance. Plots % Busy values by controller over the time period and displays threshold lines (defined in registry variable StSAN.Controller.PctBusyThreshold). |
|
• |
Pools with Severe or High Pressure on Available Usable Capacity (or Raw Capacity) |
|
• |
LUNs/Disks States. Plots the percentage of disks and LUNs in the storage array in problem states. Problem states are reported by the vendor. Resolving these issues may improve LUN performance. |
|
• |
|
• |
To return to this quick view, in the breadcrumbs, click Storage Environment. |
|
1 |
On the Storage Environment dashboard, ensure the Monitoring tab is selected. |
|
2 |
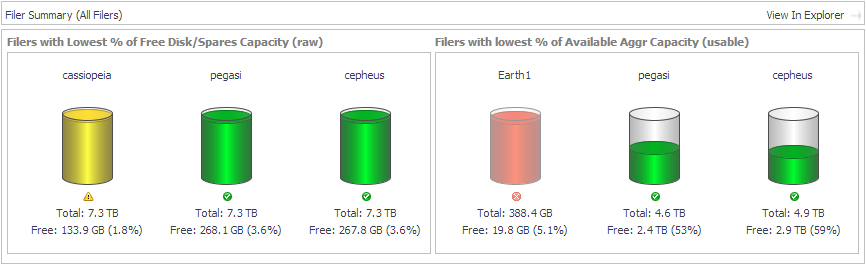
Click the Filers tile to open the Filers quick view. |

|
• |
Filers with Lowest % of Free Disk/Spares Capacity (raw). Displays cylinders showing the amount of used Free Disk/Spares Capacity (Raw). Below each cylinder, you can see total and free capacity. |
|
• |
Filers with Lowest % of Available Aggr Capacity (usable). Displays cylinders showing the amount of used Aggr Capacity (Usable) Free. Below each cylinder, you can see total and free capacity. |
|
• |
|
• |
Aggregate capacity: StSAN.FilerAggregates.PctUnallocatedCapacityThreshold.[Fatal|Critical|Warning] |
|
• |
Storage Capacity Summary. The cylinders show the amount of capacity consumed in the filer, expressed using current values for the following pairs of metrics: |
|
• |
NASVolume Performance. Plots the percentage of NASVolumes in the filer in problem states. Problem states are reported by the vendor. Resolving issues may improve volume performance. |
|
• |
LUN Performance. Plots the percentage of LUNs in the filer in problem states. Problem states are reported by the vendor. Resolving issues may improve LUN performance. |
|
• |
To explore details about the filer and its child components, click View in Explorer. See Exploring a Filer. |
|
• |
To return to this quick view, in the breadcrumbs, click Storage Environment. |
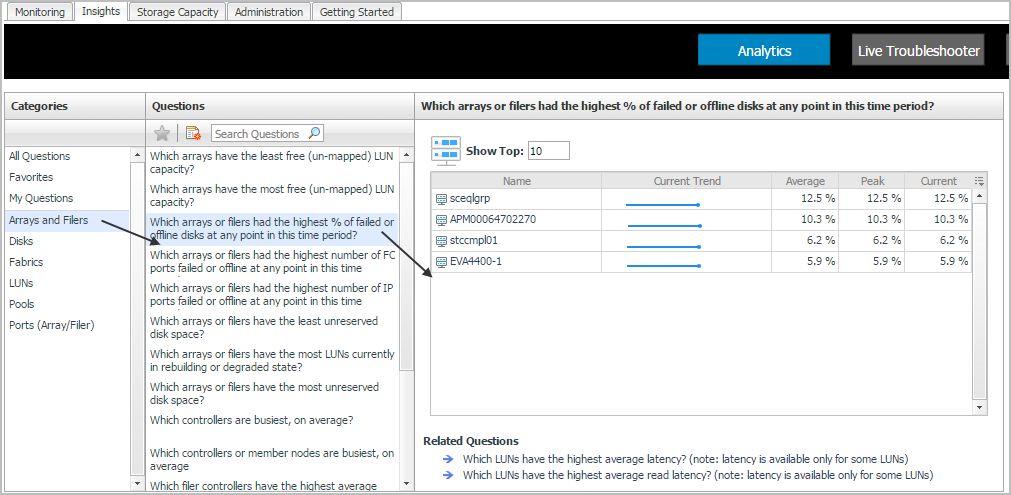
Another way to find out information about your storage environment is to ask questions. The Insights tab contains the Analytics view to show frequently-asked questions about storage environments. Answers are displayed in the form of tables and graphs. You can select questions that apply to all storage resources or to a specific type of storage resource.
|
1 |