Use this dialog to manage monitoring of Oracle Data Guard environments.
Click Data Guard.

Fill in the details of Standby connections in the Standby connections dialog.
Note: These fields cannot be edited while the status of the Spotlight connection to the Standby is Connected. To Disconnect a connection, close the Standby connections dialog, right click the Standby database in the Spotlight Browser and select Disconnect.
| Field | Description | ||||||
|---|---|---|---|---|---|---|---|
| Monitor |
Select to monitor this Primary to Standby Oracle Data Guard connection in Spotlight. | ||||||
| DB Name | The name of the Standby database. | ||||||
| Display Name |
The name of the Standby database as it is displayed in the Spotlight Browser. By default this is the DB Name. | ||||||
| Connection String |
The connection string to the Standby database. This field can be entered in one of the following ways:
| ||||||
| Oracle Username |
The Oracle Username to the Standby database. Tip: On a Logical Standby or Physical Standby with Read Only Access use the Spotlight User account used on the Primary. On a Physical Standby without Read Only Access use a SYSDBA Account. | ||||||
| Oracle Password | The password to login with the Oracle Username to the Standby database. | ||||||
| Connect As | The type of login to the Standby database. For example, NORMAL or SYSDBA. | ||||||
| Status |
Is Spotlight connected to the Standby? If not connected the Status field will indicate the reason for the error. If you edit the fields the Status field will indicate Untested. Click Test to test the connection. If successful the Status field will change to OK. Click Connect to connect. Note: If there is an error and you want to close the dialog without fixing the error, deselect the Monitor field. |
Further actions on the Standby Connections dialog.
| Action | Description |
|---|---|
| Save password details (for these connections) |
Select to save the Oracle password(s) entered into this dialog. Deselect to enter the Oracle password every time |
| Test |
Test all standby connections. Tip: Use when the Status field indicates an error or untested. Fix the error if applicable. Click Test. If the status field changes to OK then click Connect to connect. Note: Standby connections that are already connected are not tested. |
| Connect |
Connect all connections with the Monitor field selected, save all changes and close the dialog. |
| Save |
Save all changes and close the dialog. Tips:
|
| Cancel | Cancel all changes and close the dialog. |
| Help | Open this help page. |
Spotlight on Oracle Data Guard
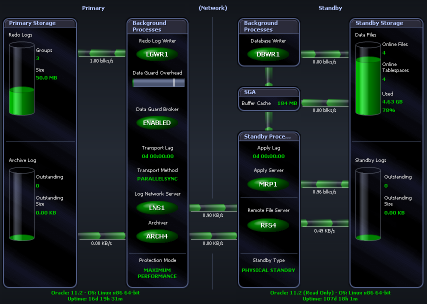
The Spotlight home page shows the flow of information and commands between various sub-components and the size and status of internal resources such as processes, disk files and memory structures.
Related statistics are grouped together on panels that are connected by a series of graphical flows and icons. Spotlight updates these flows in real time so you can see how quickly data is moving through the environment. The icons change color as Spotlight alarms are raised, upgraded, downgraded and canceled.
To see the Spotlight on Oracle Data Guard Home Page
Select the Standby database. Standby databases are indented from the Primary and show the Data Guard icon. 


Spotlight alarms indicate when the Data Guard environment exceeds acceptable performance thresholds.
| Alarm | Description |
|---|---|
| The Apply Lag is a description of how far the Standby is behind the Primary. | |
| This alarm is raised when the Apply Processes have stopped running. | |
|
The Data Guard Overhead Ratio Alarm is raised when a high proportion of the Primary's activity time is spent in Data Guard activities. | |
| Data Guard Status Alarm |
This alarm is raised when Spotlight on Oracle Data Guard has lost contact with the Standby connection (an Oracle database). Spotlight on Oracle Data Guard will attempt to reconnect. |
|
This alarm is raised when Spotlight on Oracle Data Guard has lost contact with the Standby connection (an Oracle RAC). Spotlight on Oracle Data Guard will attempt to reconnect. | |
| This alarm is raised when an unacceptable number of logs on the Standby are waiting to be processed by the Apply Server. | |
| This alarm is raised when an unacceptable number of logs on the Primary are waiting to be shipped through the Archiver to the Standby. | |
|
This alarm is raised when Spotlight on Oracle Data Guard has lost contact with one or more instances of the Oracle RAC (Standby connection). Spotlight on Oracle Data Guard will attempt to reconnect. | |
|
Keep Transport Lag low so your Recovery Point Objective can be met. | |
|
This alarm is raised when the Transport Processes have stopped for some reason. |
Note: Spotlight monitoring of Oracle RAC systems requires additional licensing.
Use Spotlight on Oracle RAC to diagnose Oracle databases on multiple host machines under the Real Application Clusters (RAC) architecture.
When monitoring the behavior of an Oracle RAC cluster, a database administrator needs to know:
To further investigate the behavior of individual database instances within the cluster, the database administrator can use Spotlight on Oracle RAC to launch Spotlight on Oracle on any particular instance within a cluster. Instance Panels
For information on Spotlight on Oracle RAC, see these sections
|
Section |
Description |
|---|---|
| Connect to Spotlight on Oracle RAC |
Create / Modify / Delete connections to Spotlight on Oracle RAC. Setup Spotlight Users and complete the Oracle User Wizard. |
| Spotlight on Oracle RAC Home Page | The Spotlight home page shows the flow of information and commands between various sub-components and the size and status of internal resources such as processes, disk files and memory structures. |
| Spotlight on Oracle RAC Alarms |
Spotlight alerts you to problems with your system by issuing an alarm. You can configure Spotlight in the level of severity that constitutes an alarm, to disable an alarm, and the actions Spotlight takes on raising the alarm. |
| Spotlight on Oracle RAC Drilldowns | When you have isolated a problem, you can display a drilldown page, whose charts and tables provide a detailed breakdown of the underlying statistics. |