The article will address the following questions:
ApexSQL Monitor SQL Server deadlock monitoring is entirely based on using SQL Server Extended Events. To meet the various user preferences, ApexSQL Monitor utilizes two different approaches in the SQL Server deadlocks monitoring: using the SQL Server native system_health extended event or using the ApexSQL Monitor’s dedicated ApexSQLDeadlock extended event. See more information on the ApexSQLDeadlock extended event below
The system_health extended event is SQL Server native extended event that, among other information, collects data about the SQL Server deadlocks. This is not the most reliable method for collecting the deadlocks, and it cannot always be guaranteed that all deadlocks are captured or that deadlocks event might be available with severe delay. To elaborate, the maximum memory assigned to the ring buffer is 4MB. Therefore, in the highly active servers it is possible that a large amount of events is 0.5MB in size which limits the available space in the system_health extended event ring_buffer for the deadlock events that are serialized to the XML format (serialized size can be over 4.5MB) so it doesn’t show up in the XEL (event file format) file up until it has been buffered out. The reason is that it either reaches the max_memory or max_events limit. The max_memory limit is set to 4Mb while the max_event limit is set to 5000 events for the system_health session
While not being the most reliable due to the previously explained SQL Server limitations it cannot always guarantee the collected deadlock data precision; it can still provide enough information in most cases. However, if it is allowed by the company policy, it is highly recommended to use the dedicated ApexSQLDealock extended event
ApexSQL Monitor reads data from the selected extended event every 60 seconds. This is a hardcoded setting that cannot be changed by the user. The time period is chosen as it grants the most optimal and precise reading, especially from the system_health extended event. Utilizing specific programming techniques, in combination with the predefined reading frequency, allows us to collect even the deadlocks that are significantly delayed as a consequence of the SQL Server system_health extended event limitations explained above and thus maximizing the precision
The user designated for monitoring of SQL Server instance must have the following permissions that allow creating, enabling, disabling and deleting ApexSQLMonitorDeadlock extended event:
No. ApexSQL Monitor doesn’t use SQL Server Trace for deadlocks monitoring. What’s more, the application doesn’t use SQL Server Trace at all, and therefore there's no overhead on monitored SQL Server that would be inevitable with use of SQL Server Trace
As being a dedicated extended event designed to collecting only SQL Server deadlocks, it doesn’t cause any measurable overhead. What’s more, it even provides lower footprint comparing to system_health extended event as queries used by the ApexSQL monitor to retrieve data can be simpler and faster since there is no need to filter out unneeded or not relevant data from the system_health extended event. Reading data from the ApexSQLMonitoDeadlock extended event is straight and without any filtering as the extended event collects only the data needed for deadlock monitoring
Yes. ApexSQLMonitorDeadlock extended event can be easily scripted from SSMS. For those interested in details about the ApexSQLMonitorDeadlock extended event, the script is provided below
CREATE EVENT SESSION [ApexSQLDeadlock] ON SERVER
ADD EVENT sqlserver.xml_deadlock_report(
    ACTION(sqlserver.database_id))
ADD TARGET package0.event_file(SET filename=N'ApexSQLDeadlock.xel')
WITH (MAX_MEMORY=4096 KB,EVENT_RETENTION_MODE=ALLOW_SINGLE_EVENT_LOSS,MAX_DISPATCH_LATENCY=30 SECONDS,MAX_EVENT_SIZE=0 KB,MEMORY_PARTITION_MODE=NONE,TRACK_CAUSALITY=OFF,STARTUP_STATE=ON)
GO
ApexSQL Monitor deadlock monitoring and alerting are enabled by default using the system_health extended event.
To access the deadlock monitoring configuration page
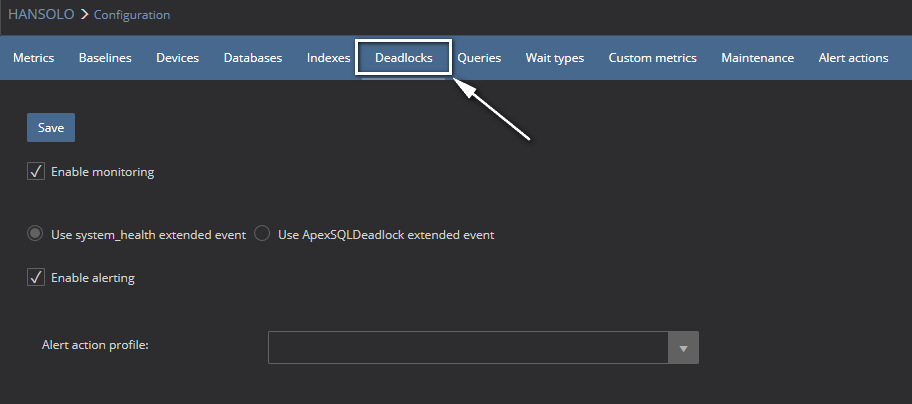
Use Enable monitoring checkbox to enable or disable deadlocks monitoring
Select the radio button to switch the deadlock monitoring method between the system_health and ApexSQLDeadlock
Use the Enable alerting checkbox to turn on or off alerting for collected deadlocks
Yes. ApexSQL Monitor handles the ApexSQLMonitordeadlock extended event on its own. It can create, remove, disable or enable ApexSQLMonitorDeadlock according to the actions performed by the user within the application
To access the deadlocks page;
The deadlocks page is now displayed
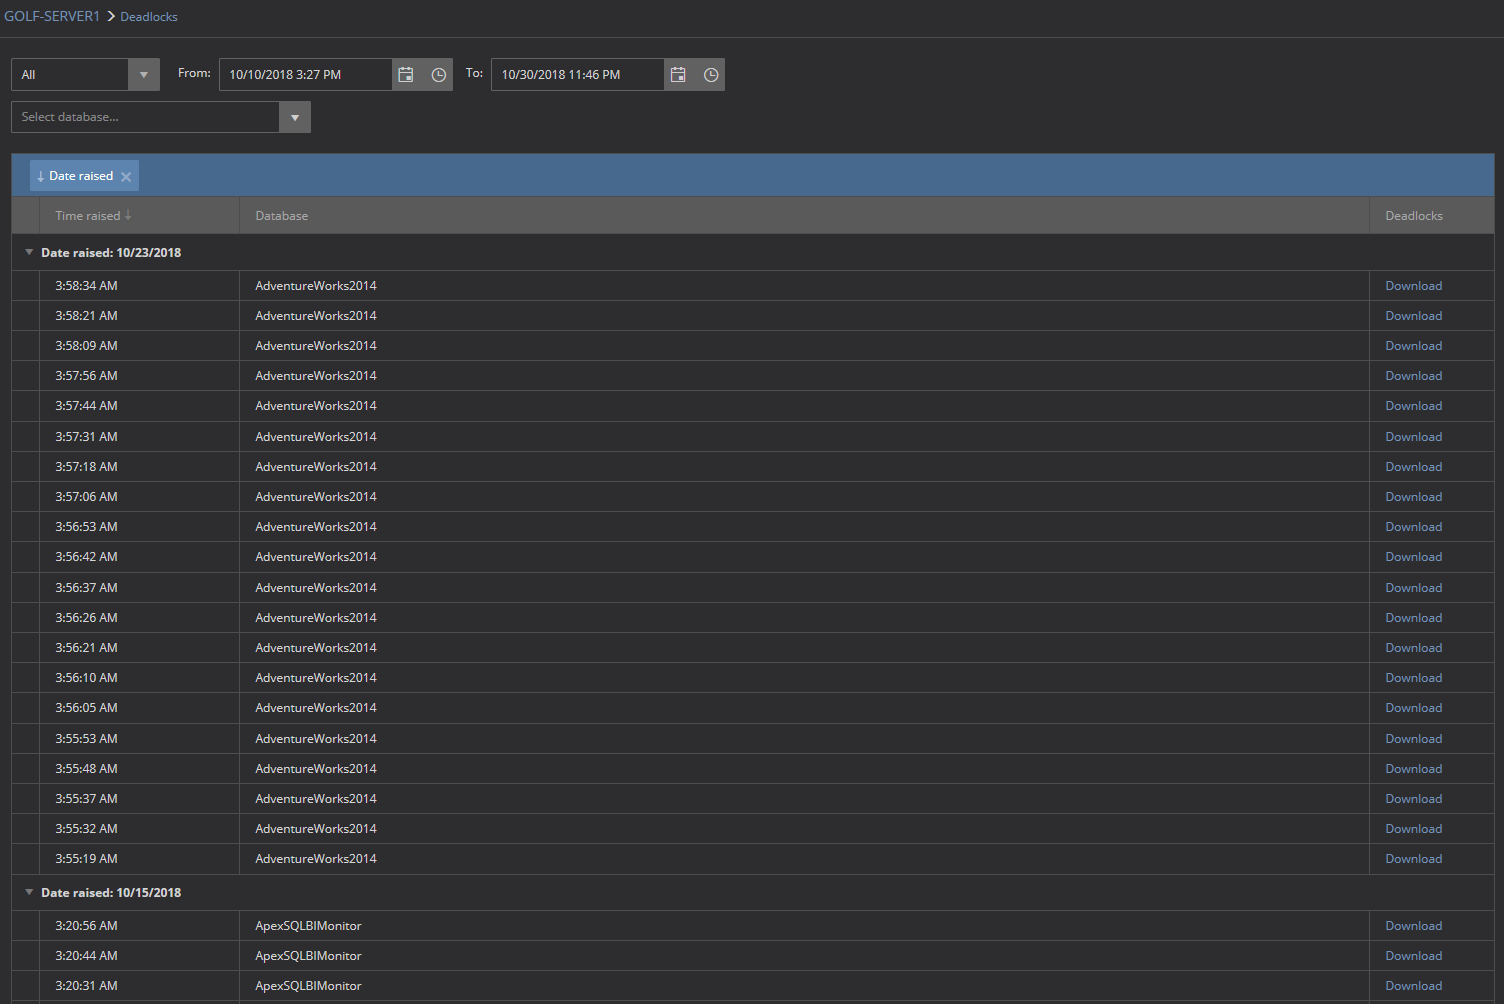
By default, deadlocks are sorted according to the date and time when they occur, in descending order
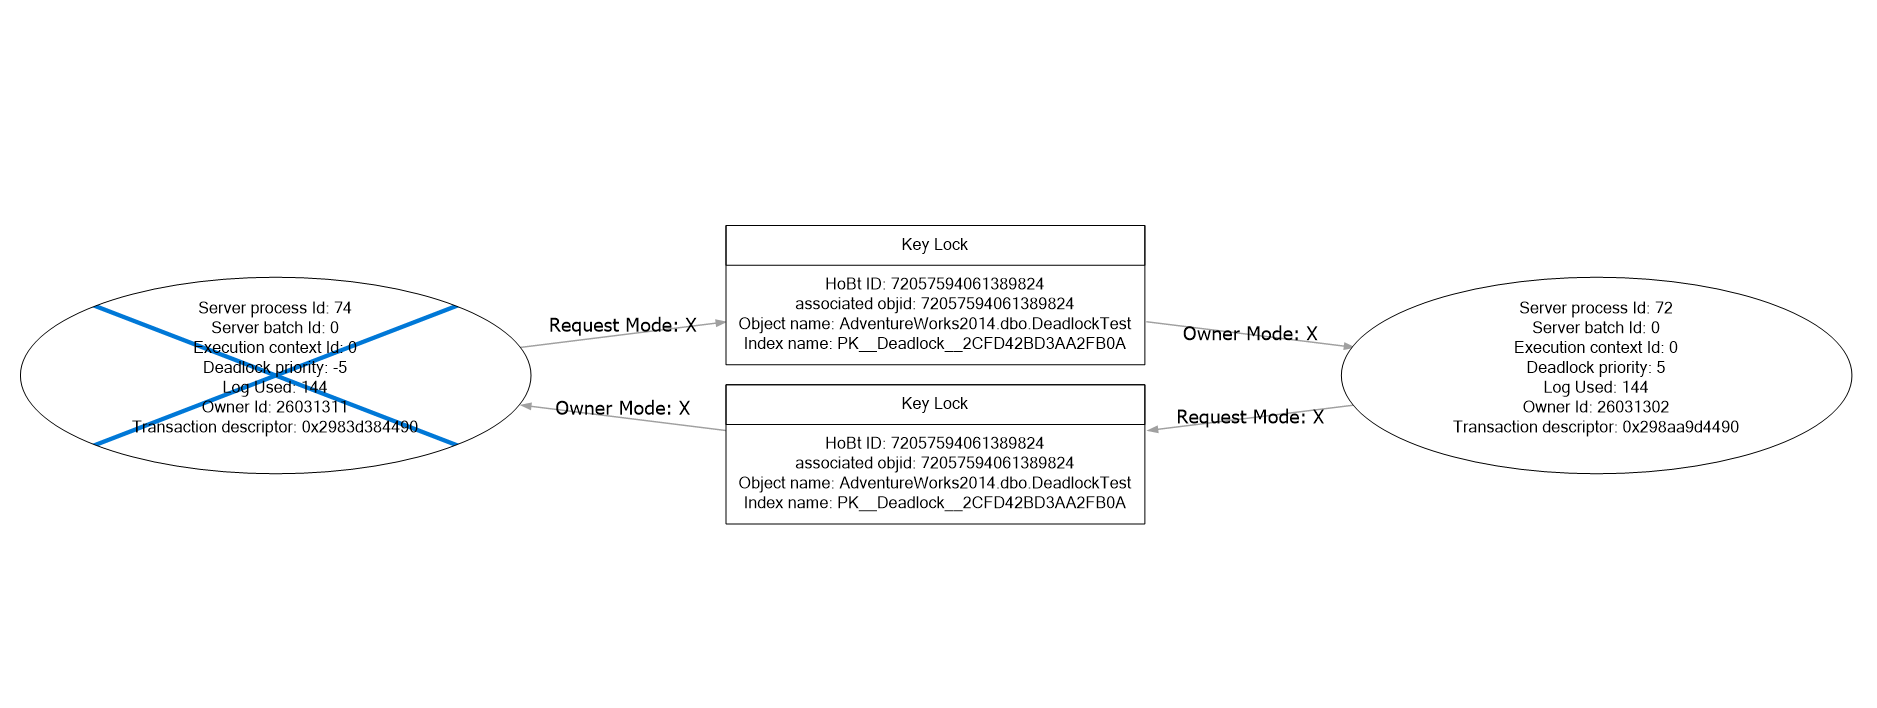
Yes. The application collects and stores the deadlock information in the repository database as XDL files. The XDL file for each deadlock can be downloaded using the Download link for the desired deadlock in the Deadlocks column where deadlocks are listed.
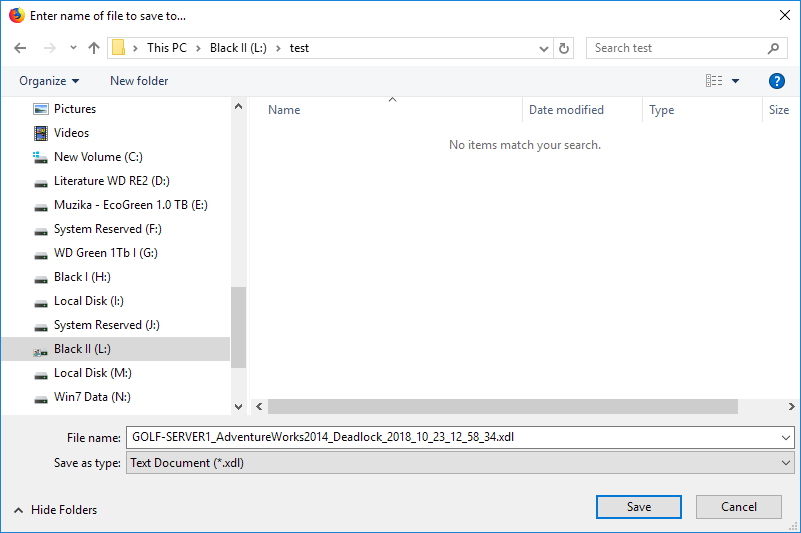
The XDL file default naming schema is <Servername>_<databasename>_<Deadlock_Date_Time>.xdl
The saved XDL file can be opened using the SSMS
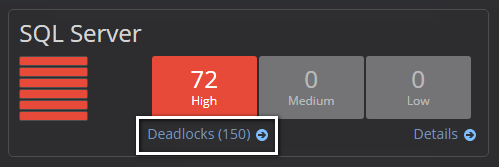
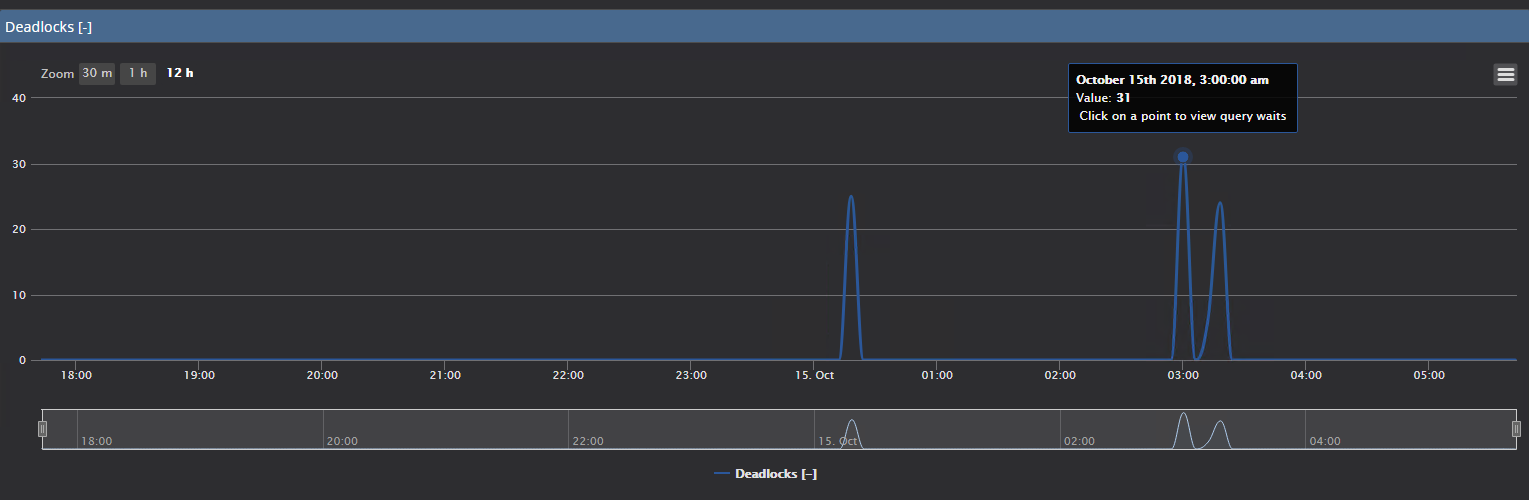
ApexSQL Monitor displays the number of monitored deadlocks over the time in the form of the metrics chart in the SQL Server metrics page. The Deadlocks chart shows the number of deadlocks collected for the sampling period. It can be used and configured as any other metric
No. Uninstalling the application will remove ApexSQLMonitorDeadlock extended event from all monitored SQL Server instances
That can be done using the SSMS
To stop ApexSQLMonitorDeadlock extended event session
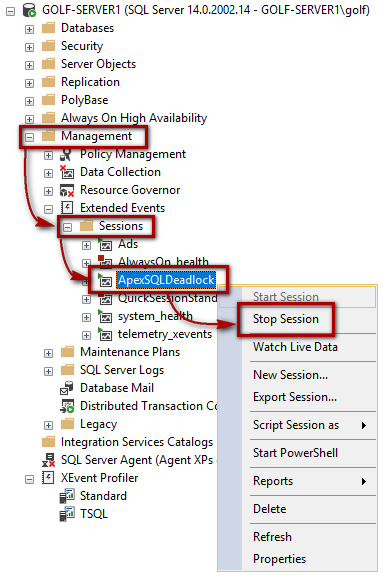
Use the same method to start the previously stopped session
To do the same using the T-SQL, use the following scripts:
ALTER EVENT SESSION [ApexSQLDeadlock] ON SERVER
WITH (STARTUP_STATE=OFF)
GO
ALTER EVENT SESSION [ApexSQLDeadlock] ON SERVER
WITH (STARTUP_STATE=ON)
GO
