-
标题
How to monitor database status changes in SQL Server -
解决办法
Database status overview
Every database in a SQL Server environment has two basic states: full availability (online state) or full unavailability (offline state).
SQL Server incorporates and utilizes seven possible database states, which are present in the grid below, ordered by availability (from fully available to fully unavailable), and with a short explanation for each state:
Database state Description Availability Online Database is functioning normally, and it is available for use. Available Restoring Database is in process of restoration, which means that user initiated the database restoring. Unavailable (without errors, user-induced) Recovering Database is in process of recovering. If succeed, it will change state to online. If process fails, it will change state to suspect. Unavailable (without errors) Recovery pending Recovery process failed in between, but database is not damaged. Further user action is required in order to solve the issue (see in the next paragraph). Unavailable (error occurred) Suspect In this state, there is possibility that database is or was damaged during the recover process. Further user action is required in order to solve the issue. Unavailable (error occurred) Emergency This database state change is user-induced, in order to safely perform maintenance, restore or recovering process on particular database. One note: sysadmin rights are required to manage this database state. Unavailable (without errors, user-induced) Offline Database is not functioning, and is unavailable for use. This state is also user-induced, and it requires further action, in order to change a database state. Unavailable (without errors, user-induced) Quick reference when transition between database states is interrupted
There are several occasions when a smooth transition between database states could fail. Transitions from restoring, recovering or recovery pending database states to online state can be interrupted by events that stop previously active processes of database back up, restoring or recovery. These events could be disk failures, network connection issues, corrupted database files and other.
In order to solve these database states, perform actions shown below with caution, and with note that causes why interruptions happen can be various (already mentioned issues during the process of database restoration/recover etc.):
If the database is in a permanent restoring state: run this script, to force the recovering process and set database state to online:
RESTORE DATABASE < database_name >
WITH RECOVERY
If the database is in a permanent recovering state:
stop SQL Server service;
move the log file for that database (usually in c:\Program Files\Microsoft SQL Server\MSSQL12.MSSQLSERVER\MSSQL\DATA\<database_name>_log.ldf) to another place;
take problematic database offline;
move back the log file to its original folder and take database online.
If the database is in a permanent recovery pending state: take database offline, then online:
ALTER DATABASE < database_name >

SET OFFLINE
GO

ALTER DATABASE < database_name >

SET ONLINE
GO
If needed, run this script if the database is in a suspect state:
EXEC sp_resetstatus < database_name >
GO

ALTER DATABASE < database_name >

SET EMERGENCY
GO

DBCC CHECKDB (< database_name >)
GO

ALTER DATABASE < database_name >

SET SINGLE_USER
WITH

ROLLBACK IMMEDIATE
GO

DBCC CHECKDB (
		< database_name >,
		REPAIR_ALLOW_DATA_LOSS
		)
GO

ALTER DATABASE < database_name >

SET MULTI_USER
GO
Determine a database(s) status changes
Database status changes can be determined programmatically with PowerShell, by parsing events related to offline and online database(s) states from Application log within Event Viewer:
#The first part of the script is fetching events related to OFFLINE status;
Get-WinEvent -FilterHashtable @{logname=’application’;id=5084;} |
?{$_.message -match "Setting database option OFFLINE"} -ErrorAction SilentlyContinue |
Out-File d:\DatabaseStatusChange.txt -Append -Force
##
#The second part of the script is fetching events related to ONLINE status;
Get-WinEvent -FilterHashtable @{logname=’application’;id=5084;} |
?{$_.message -match "Setting database option ONLINE"} -ErrorAction SilentlyContinue |
Out-File d:\DatabaseStatusChange.txt -Append -Force
#After data fetching, all events will be parsed into one text file, and every next attempt of executing this script will be appended in the same text file;
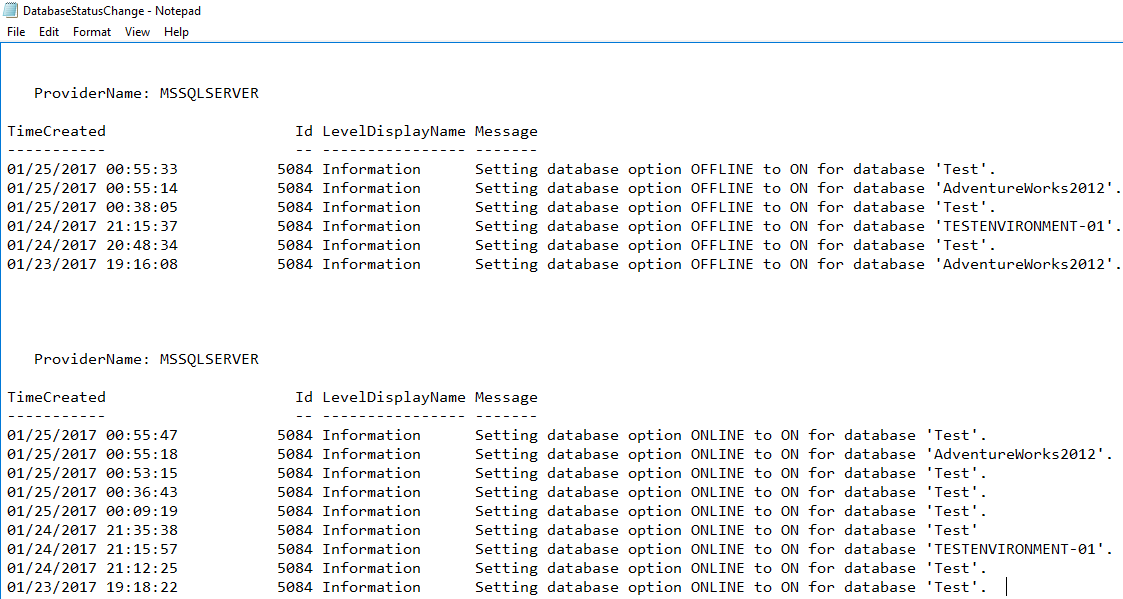
The result should appear like this:
Within this filtered log file, moments when particular database went offline or online can be easily compared by timestamp (in TimeCreated column).
To constantly monitor database status change, include the script from above within SQL Server Agent job (refer to this article in order to create mentioned job), if needed.
Monitoring database status change with ApexSQL Monitor
As SQL Server performance monitoring tool, ApexSQL Monitor is continuously auditing status of all databases and their changes present on a monitored SQL server instance, with corresponding metric and alerts.
Information about database status change from Dashboard
On the left pane, when All instances is selected, the information on all databases status will appear in the Group dashboard’s grid:
In this case, shown above, all databases are in function.
If some of the databases within the monitored instance(s) changed the status in some moment, the alert icon will appear in the grid, like shown below:

Select the particular instance in the left pane, or directly from the Group dashboard, click on the alert counter in a Database panel, to review present alert or alerts:
In the Alerts subsystem, there is an alert related to the Test database, which can be seen within Instance column, and it means that Test database’s status has changed:
Status changed special performance counter
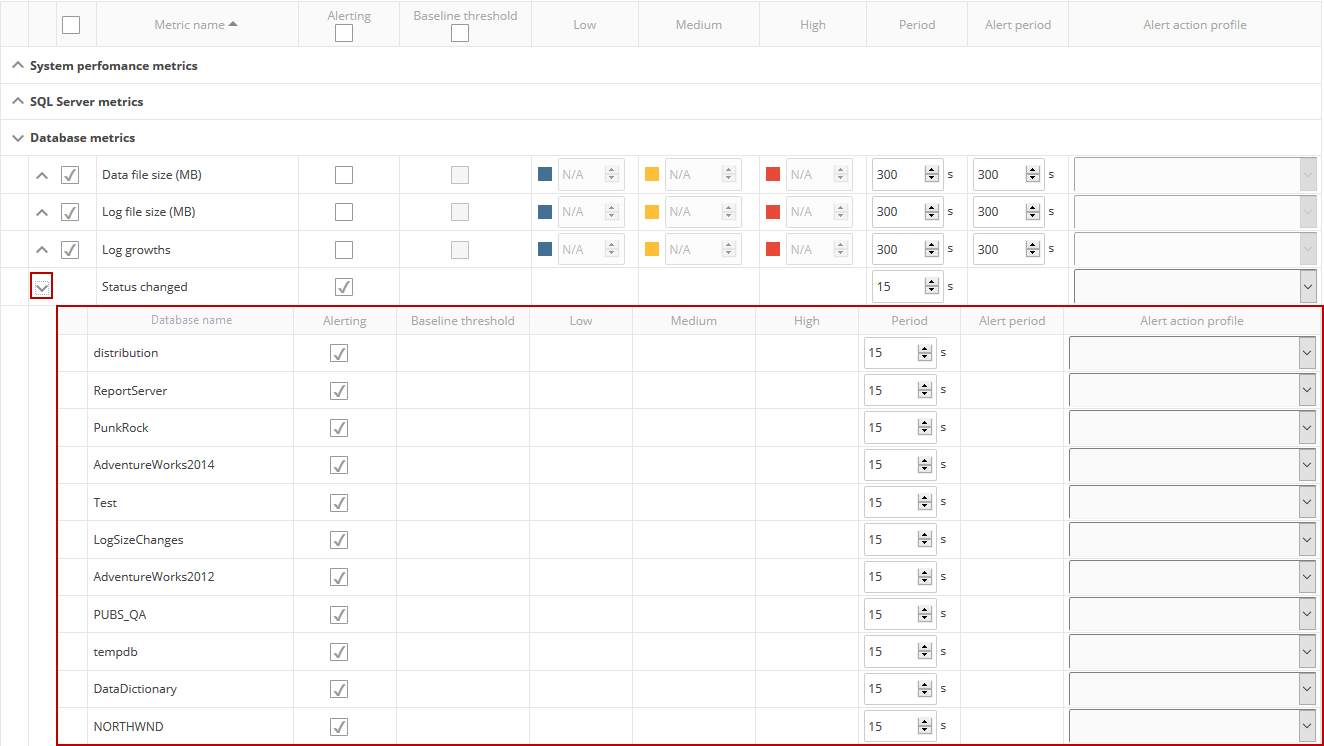
Placed under Database metrics, in Configuration subsystem, "Status changed" is the special performance counter, which actually tracks these events:
Status changed counter can be set to particular databases by clicking icon close to the metric name, and database list will appear in the grid:
Resolving alerts related to Status changed counter
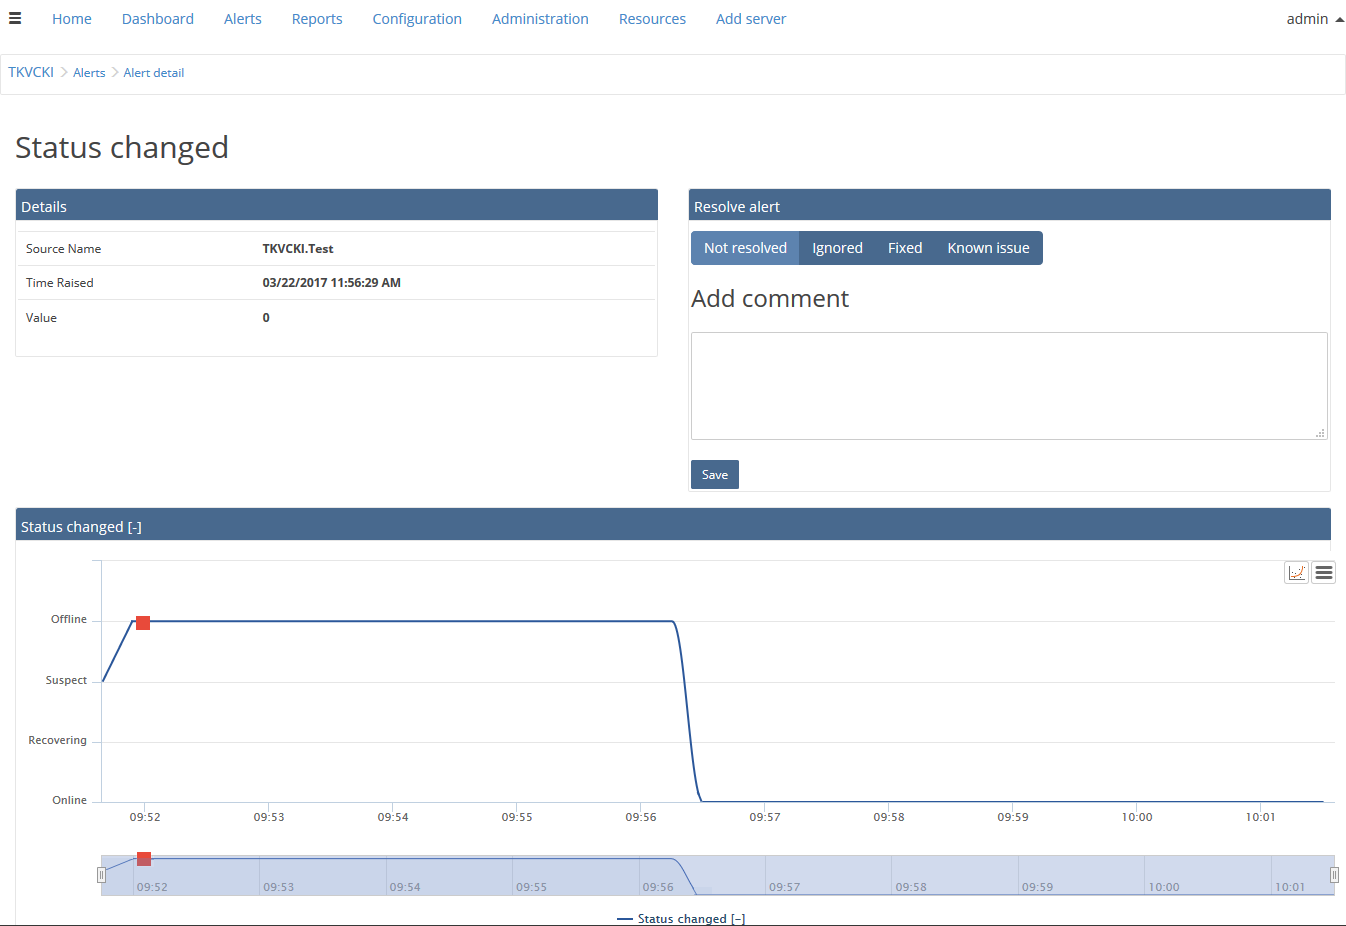
To examine and resolve alerts related to the database status change, go to the Alerts subsystem, and select the alert, like shown below:
In this view, present on the picture below, it can be easily seen on which instance particular database (Test) changed its status. Also, some of the previously mentioned database statuses are present on the graph to show the transition between the states.
The selected alert represents the moment when Test database went offline, with exact date and time.
Automating alerts for database status changes
During monitoring of database status changes, to be effectively notified when a database changes status, set the email profile and/or use the custom command alert action, to make sure that particular database is always functioning.
Change the status of the particular database from offline to online (PowerShell)
In order to set this alert action, download Change_Database_Status.ps1 PowerShell script from this location, and place it on a desired location.
This script collects information on particular database’s status, and if the status is offline, the script will set it online. If it is already online (aka normal), the script will terminate.
[System.Reflection.Assembly]::LoadWithPartialName('Microsoft.SqlServer.SMO') | out-null
$s = New-Object ('Microsoft.SqlServer.Management.Smo.Server') <server_name>
$db = $s.Databases.item('<database_name>')
$db.status
if ($db.status -eq 'OFFLINE, AUTOCLOSED'){$db.SetOnline()}
else {Break}
Next, customize the downloaded script, particularly <server_name> and <database_name> strings with valid and desired ones, bolded above.
After downloading and customizing the script file, set the custom command alert action within the Status Changed counter, and include this script:
powershell.exe "d:\change_database_status.ps1"
Every time the monitored database status is changed, the alert action will call the Change_Database_Status file and execute the script. Also, within alert action profile, multiple custom command alert actions can be included, just set different servers and databases in mentioned PowerShell script.
Downloads
Please download the script(s) associated with this article on our GitHub repository.
Please contact us for any problems or questions with the scripts.


