SQL Server monitoring includes isolating processes that cause performance issues and fixing them. Commonly monitored performance metrics, such as page reads and writes per second, processor utilization, network usage, memory usage, etc. show the SQL Server status. For further analysis, it’s necessary to monitor what is happening on SQL Server and causes these metric values. This is where query monitoring comes into play.
Queries that are resource intensive use much hardware resources on the server during their execution. While a query uses hardware resources, other queries are awaiting for the resources to be freed. A long running query can cause blocking.
Analysis of executed queries should provide information on how much resources are used, and further analysis of code and database design should focus on whether it is possible to optimize a resource intensive query, and if possible optimize it.
Keep in mind that hardware resources are not used only by SQL Server, and that the monitoring results can be different on the testing and production machine, if all applications are processes on these machines are not identical.
In the previous parts of this series, we described various methods to find long running queries: Activity Monitor and Data Collection, dynamic management views and functions, SQL traces via SQL Server Profiler, and SQL traces via T-SQL statements. In this part, we will present a solution that provides query execution details in a user-friendly GUI.
ApexSQL Monitor is a performance monitoring tool that monitors a wide range of Windows and SQL Server metrics on multiple local and remote machines and SQL Server instances and helps you identify performance issues and deadlocks. It monitors the most important SQL Server processor, memory, disk, and network performance metrics, such as buffer cache hit ratio, batch requests per second, page reads and writes per second, user connections, target and total server memory, batch requests, etc.
ApexSQL Monitor tracks query execution and provides enough information to detect the ones that use the most resources. It also provides alerts to notify you when a specific parameters exceeds the predefined critical value.
By default, the list of 20 slowest queries executed against specified SQL Server is shown. The number of shown queries can be modified. These queries are also shown in the CPU (ms), execution time (ms), and I/O per sec graphs.
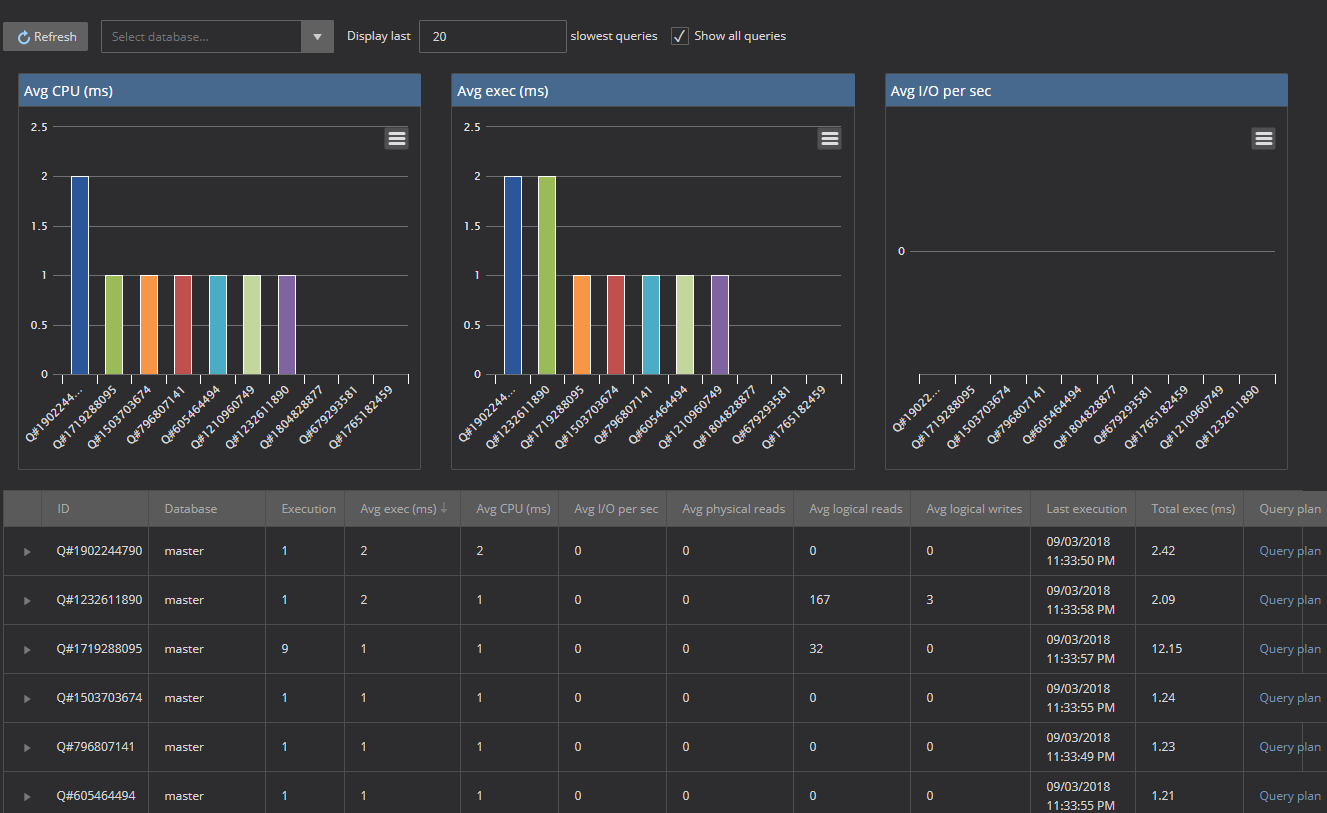
The information shown for each query is the database against which the query is executed, execution count, average execution time (ms), average CPU time (ms), average physical reads, average logical reads, average logical writes, last execution time, and total execution time.
Both total query execution time and average execution time are shown, so you don’t have to calculate it manually. The average execution time is calculated as the total execution time divided by the number of executions. It also shows the number of executions, as this is an important parameter needed for query optimization. It’s not only important how long a query is executed, but also how many times it has been executed. A large number of executions should be investigated and optimized.
The next set of monitored metrics are physical and logical reads and writes. Logical metrics are related to memory and physical with disk operations.
Average physical reads shows the average number pages read from disk for a specific query.
Average logical reads shows the average number of pages read from memory.
Average logical writes shows the average number of pages written to memory.
If the data needed for the query execution doesn’t exist in memory, it is read from a disk. As read/write disk operations are much slower than memory ones, consequence is performance degradation. This doesn’t mean that a high number of logical reads is preferred. It should also be investigated, as it can be caused by non-optimal indexing or badly designed query.
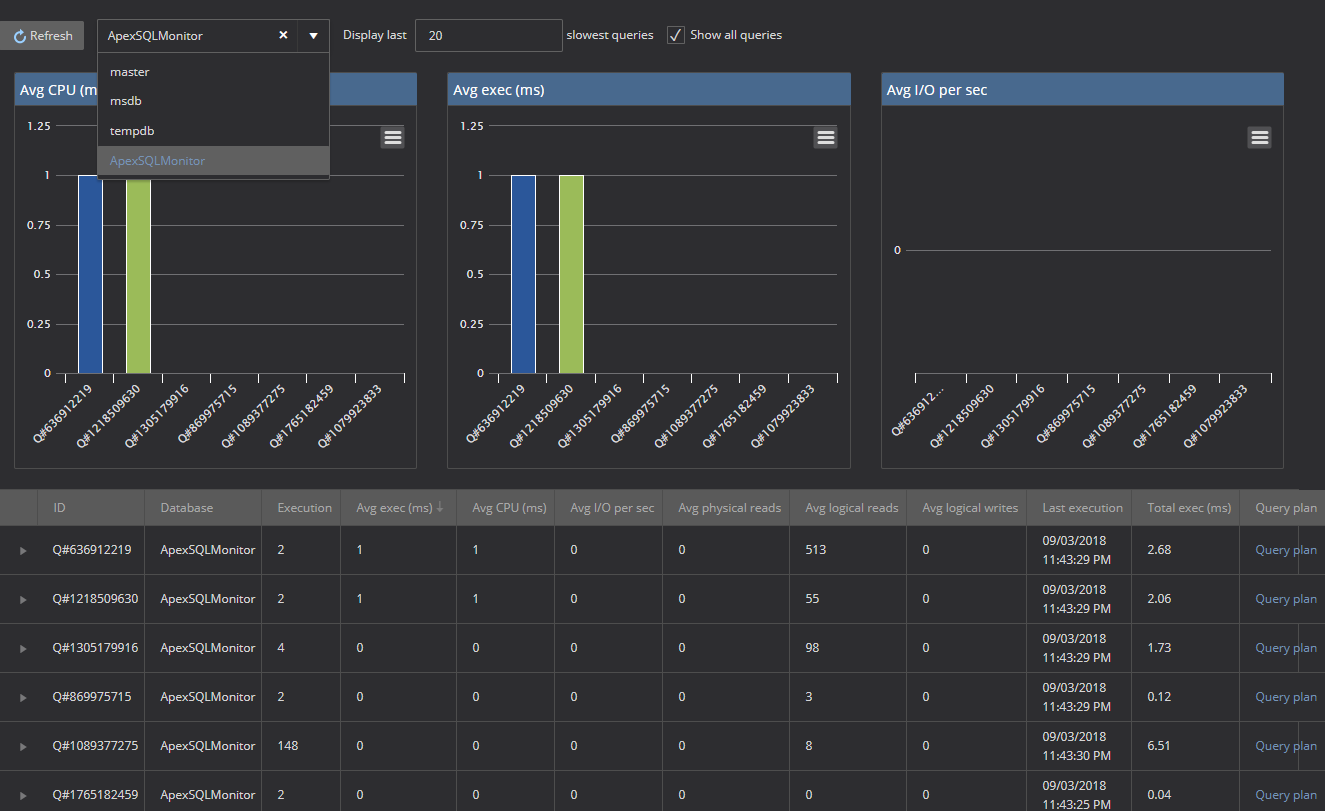
Another useful feature of the query performance grid is that it can be filtered by the database name to see queries executed against a specific database. To do that, select database from drop-down.
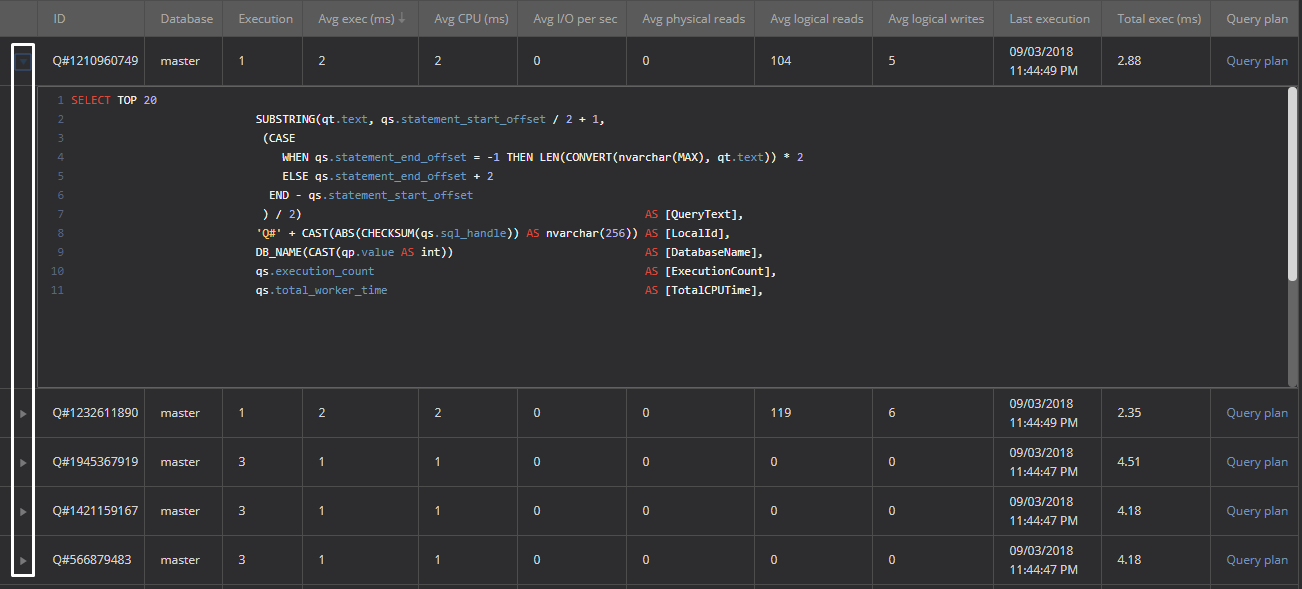
To see code of a specific query, simply expand arrow left of the query ID
Unlike with Activity Monitor and Data Collection presented in the previous parts of this series, with ApexSQL Monitor the information is grouped and can be easily filtered. SQL traces provide such functionality, but not out of the box, you have to import them into a SQL table first and then use T-SQL statements to accomplish that.
ApexSQL Monitor provides a GUI interface where you can obtain the most important query performance details without any coding knowledge, knowledge of system views and functions, or native SQL Server features available only in specific SQL Server editions.
Resources: Monitor and Tune for Performance Server Performance and Activity Monitoring Identify Bottlenecks
