When it comes to monitoring SQL Server performance, there are a few native SQL Server solutions that provide out of the box performance monitoring. We have written about some of them here: A DBA guide to SQL Server performance troubleshooting – Part 2 – Monitoring utilities.
The problem comes in when you aren’t able to constantly actively monitor your systems. For example, if you experience a performance spike while your monitor is unattended, and this ultimately results in a system slowdown or failure, your systems were essentially unmonitored. If certain metrics like disk space usage hit a critical point, during off hours, vacations, holidays, etc., similar consequences can occur. So, unless you can actively observe them essentially 24x7, you risk monitoring gaps that could result in system slowdown or even failure.
By setting the alerting properly, you can be allowed to passively monitor your systems while proactively getting alerts.
Alerting in SQL Server is available via Alerts. This feature allows you to be notified when the metric reaches a specific threshold value. SQL Server Agent can send messages, launch applications, or execute tasks if an alert is triggered.
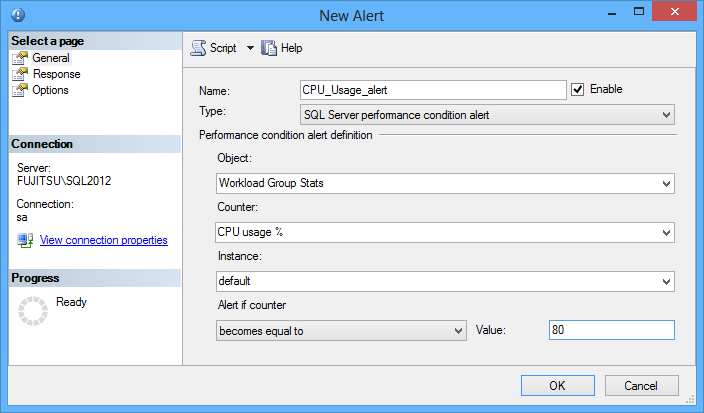
To configure an alert:
In the Performance condition alert definition section, specify the performance metric you want to be alerted for and the threshold value
In the Response tab, select whether you want to execute a SQL Server job, or send a notification by email, pager, or net send. The latter two options will be removed in future versions of SQL Server
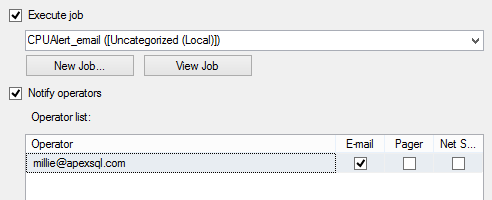
Note that for sending emails, Database Mail in SQL Server Management Studio has to be configured.
SQL Server Alerts provide a mechanism to be proactively notified of any performance issues on your SQL Server instance. They provide granular configuration of SQL Server performance metrics and multiple actions for each triggered alert.
For each metric, you can set different threshold values and actions. However, to do that, you must create multiple alerts, as a single alert can have only one threshold value.
Although the dialogs are self-explanatory, setting an alarm requires a number of steps. For a large number of alarms and several threshold values for each, this can be very time consuming. Reviewing, modifying and purging them can also be time-consuming.
Some metrics cannot be configured at the SQL Server instance level, you have to configure them for each database, even if the threshold values is the same for all databases. If the SQL Server crashes, you will not be notified that something went wrong and might think that there are no performance issues.
As Alerts are based on SQL Server Agent, the feature is available only in the Enterprise and Standard editions. The performance metrics for the system performance are not available.
ApexSQL Monitor is a SQL Server and system performance monitoring tool that provides a set of operating system, SQL Server, and database performance metrics. It monitors performance in real time and presents the metric values in graphs. Performance metrics are configurable, for each you can specify whether to trigger an alert when a critical value is reached, as well as three threshold values for low, medium, and high severity levels and alerting frequency.
To select a performance metric for monitoring:
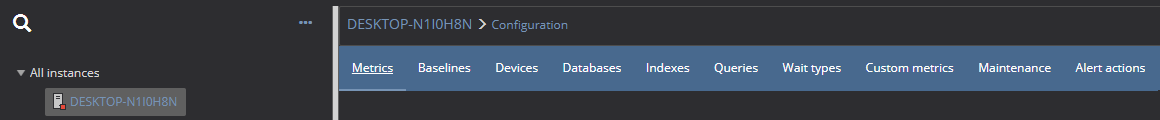
In the ApexSQL Monitor GUI, select Metrics in the menu
Select SQL Server instance in the SQL Server instance list, or configure metric settings on a group level.
Note that the metric and alert configuration is applied to all objects hierarchically under the selected object and the object itself. In other words, if you select the All instances in the list, the settings will be applied to all SQL Server instances.
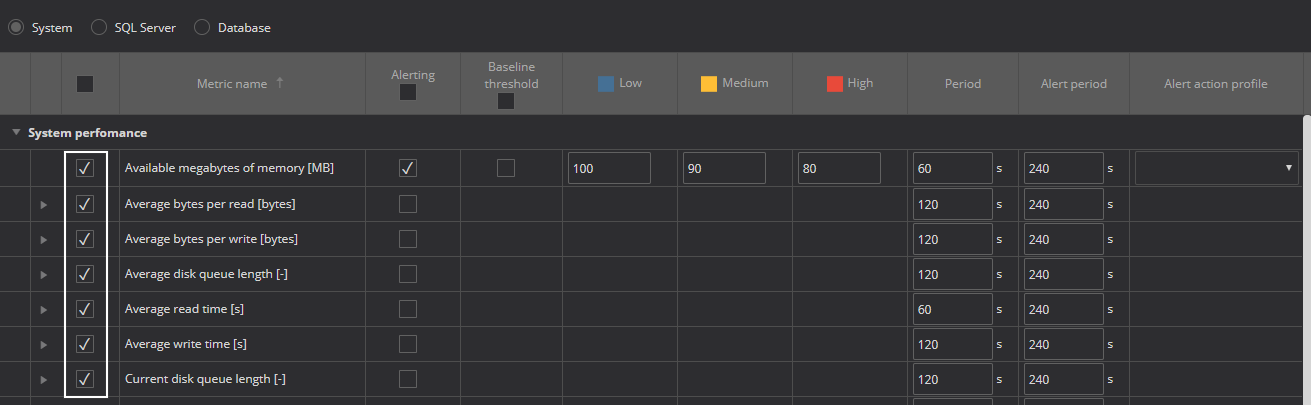
Select the metrics to monitor by checking their check box
To make the most of alerting, you have to understand the activity/state the performance metrics represent, how a change of the metric value affects performance, know usual values for your system, and recommended values.
The performance metric values don’t always have to match recommended ones. For some performance metrics, deviations are acceptable. Also, other metrics don’t have a specific recommended value. You should monitor their value over time and set a baseline.
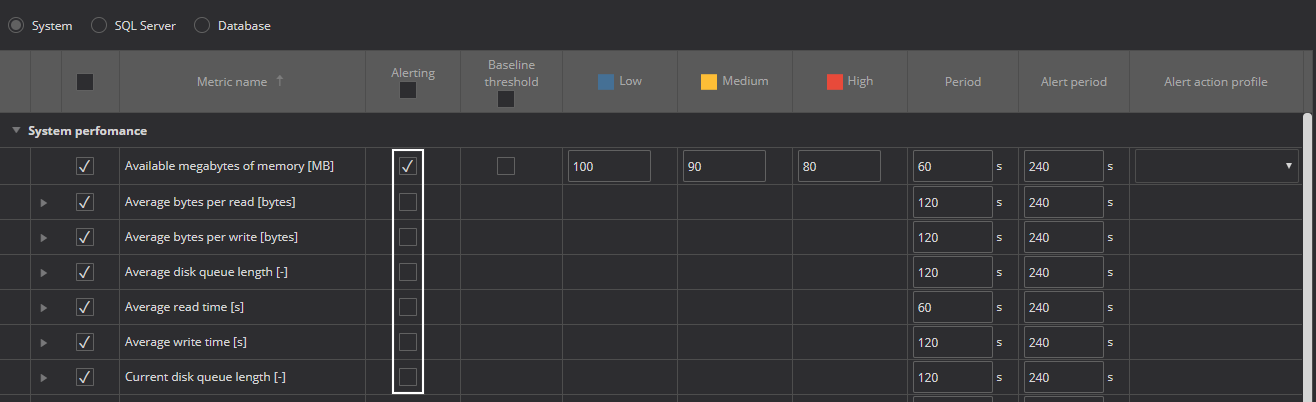
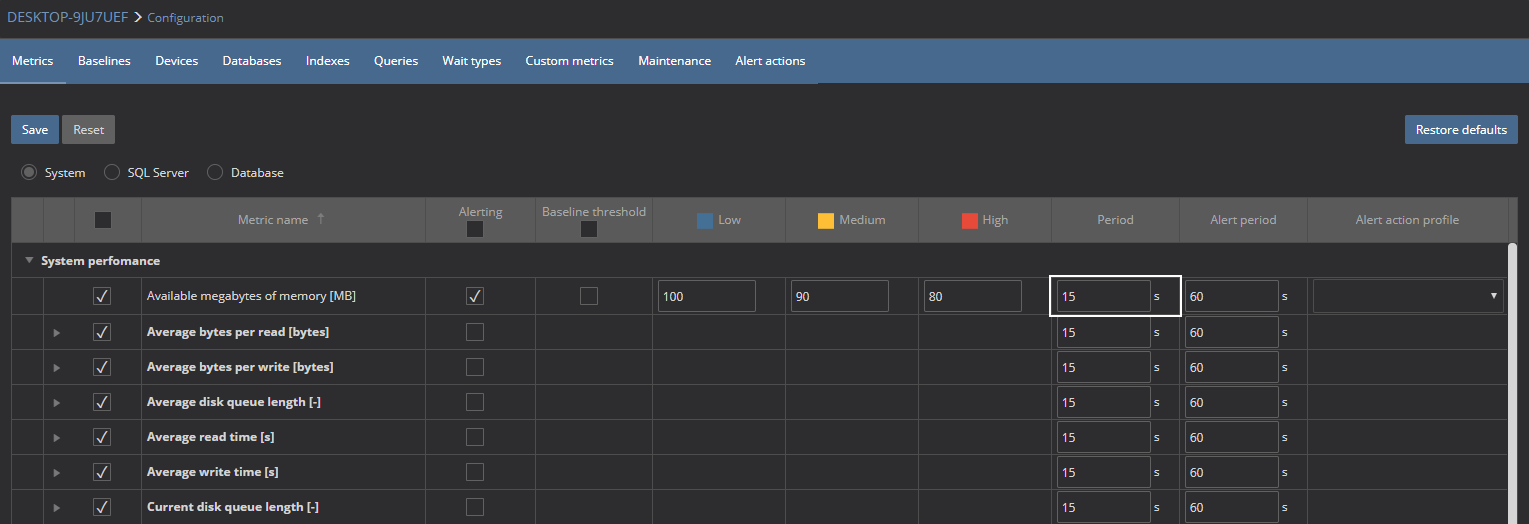
Select the performance metrics for which ApexSQL Monitor will trigger alerts. To do that, check the adequate Alerting check box:
Alerts should not make excessive noise, but at the same time, they must be reliable and triggered in all critical situations. By updating the Alert period column, it is possible to define the length of time for which a value must be exceeding the threshold before the alert is triggered.
For each alert raised, you should take adequate actions. To be able to do that, you have to understand the metric, be ready in advance, and have a what-to-do list prepared. In ApexSQL Monitor, you can also execute SQL script or shell command by setting an alert action for desired metric.
Set alert thresholds for all three threshold values: low, medium, and high. ApexSQL Monitor offers default values where possible. These values are just a recommendation based on the threshold values commonly used and might not be adequate for your environment. For example, a general recommendation for the processor time usage is 80%. In time of heavy workload on your servers, you might not want to be spammed by alerts unless the processor uses 85% of its time.
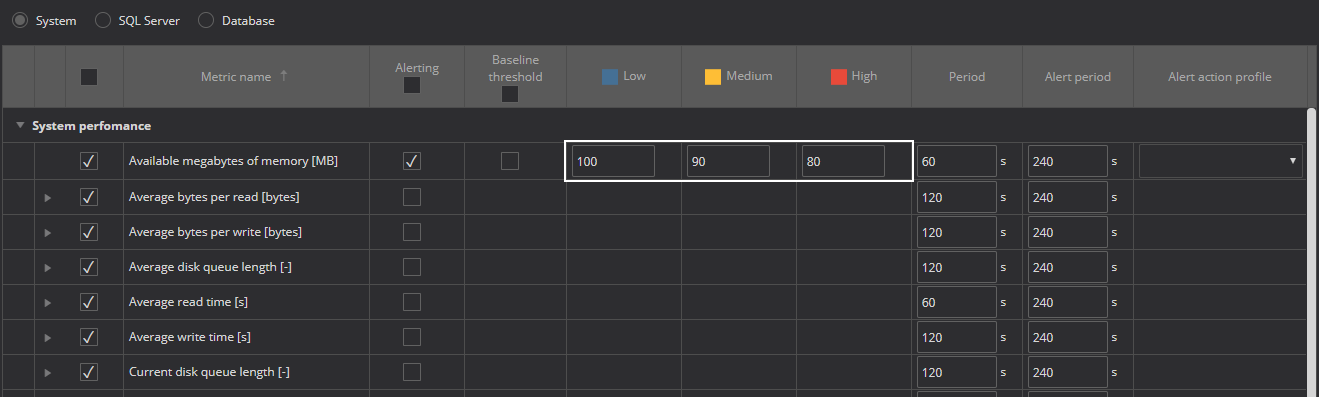
It’s recommended to set all three severity alert thresholds. Besides having more granular alerting, you’ll be aware when the alert severity changes.
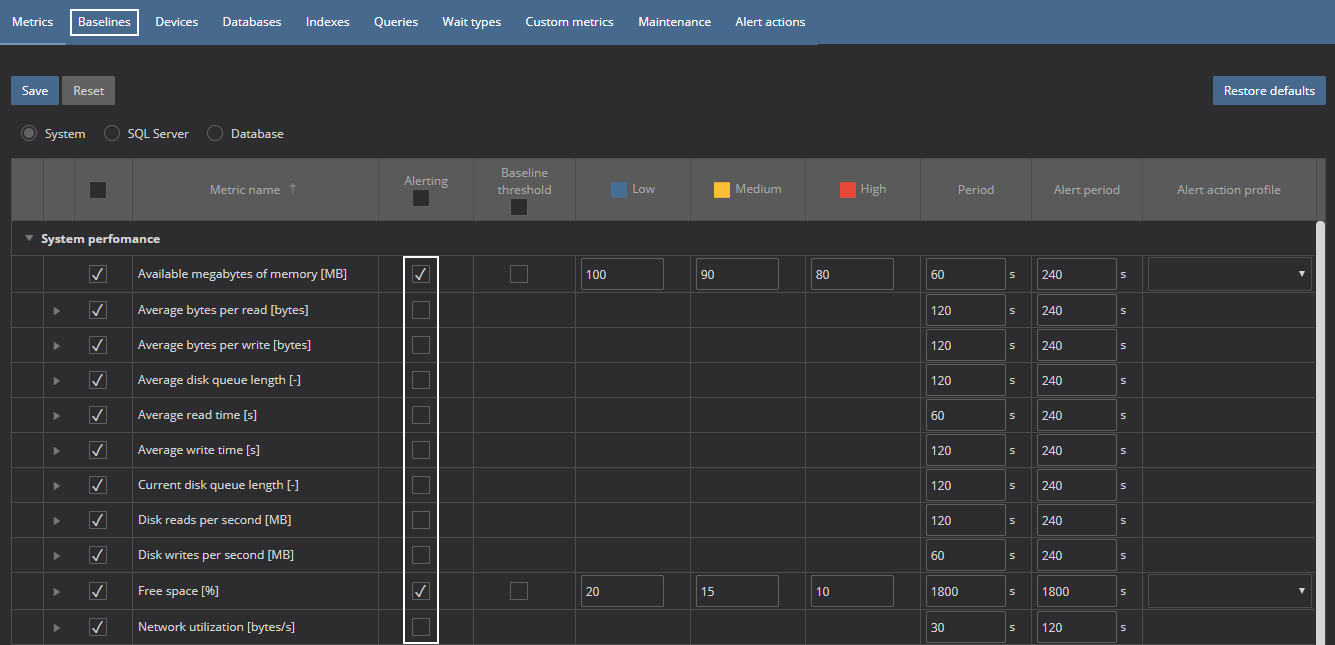
For some metrics, there’s no recommended threshold value, due to the metric nature. There are also metrics that don’t have fixed recommended values, so you should monitor the metric for a while, calculate the baseline by using the Configure baselines option, and check the Baseline threshold check box to use determined threshold values on your system:
With ApexSQL Monitor, even if the alert is cleared but the situation not solved, the next time the metric is measured, as the value is still above the threshold, an alert will be triggered. This provides reliability in situations when alerts are cleared by mistake, or taken actions don’t resolve the issue.
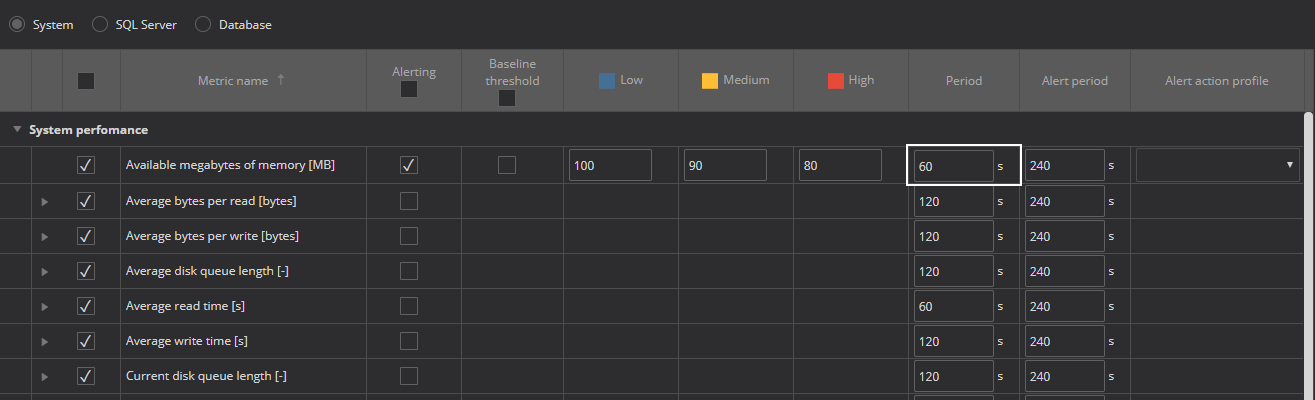
Update the time in the Period column to set the frequency that will provide sufficient information for performance monitoring and troubleshooting
The period is applied to both performance metric reading and alert triggering. As said, ApexSQL Monitor will add almost no overhead by more frequent metric reading and alert triggering, but it will make your central repository database fill in faster.
When the alerts are completely configured, it’s recommended to watch the system for a while, understand how the alerts represent environment performance, and prepare action items you will take when a metric reaches its threshold and triggers an alert
You can also test them. It’s the system you should rely on and that will make you safe. So make sure you can really rely on it. At the same time, test the actions you would take in case the situation really happens in production.
Alerts in ApexSQL Monitor are configured easily and quickly. Three different threshold values can be set for each performance metric. Besides for predefined list of system, SQL Server, and database performance metrics, alerts can be configured and triggered for custom SQL Server and database performance metrics as well. Alerting for databases on the SQL Server Express edition is supported.
