SQL Server performance reports are important for analyzing current and historical SQL Server performance.
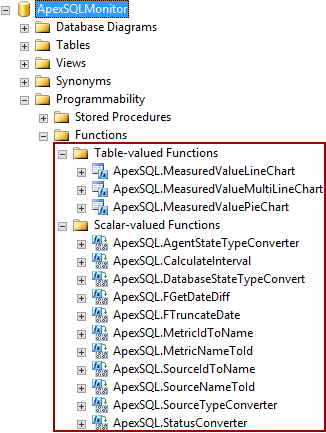
ApexSQL Monitor gathers and stores all collected performance data into a single central repository database that is used for creating the reports that are part of the application. But this repository be queried against for custom SQL Server performance reporting. The repository data is not human readable in most cases, so to convert the raw data to helpful information that can be viewed and utilized by end users, a set of SQL Server “helper” functions was created and will be presented in the article. These easy to use functions will translate the underlying data into useful query results and even reports. Once the functions are created in the repository database, those can be used as part of this custom SQL Server performance solution.
There are two types of functions that will be used for this purpose:
The function names are mainly self-descriptive and additional comments are added directly within the script where needed
Once added we can visually confirm that all functions are created in the ApexSQL Monitor database
With these functions you are ready to begin custom reporting.
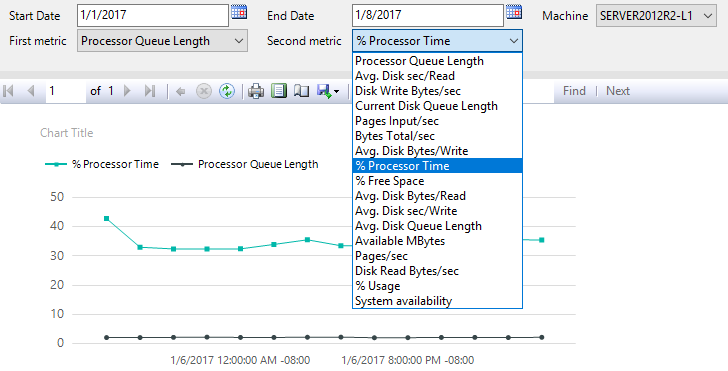
When you begin reporting you will often be asked to pick a Metric name and/or a Metric source type. The SSRS reports provided will list these in picklists, but if you are interacting with the ApexSQL functions directly, you will need literals for these values. See Appendix A for a full list, and also SQL to query the tables yourself
The following are some reports that user can use as is, but also thanks to the modularity those can also serve as templates that can be easily altered for creating the reports that will meet the specific user needs
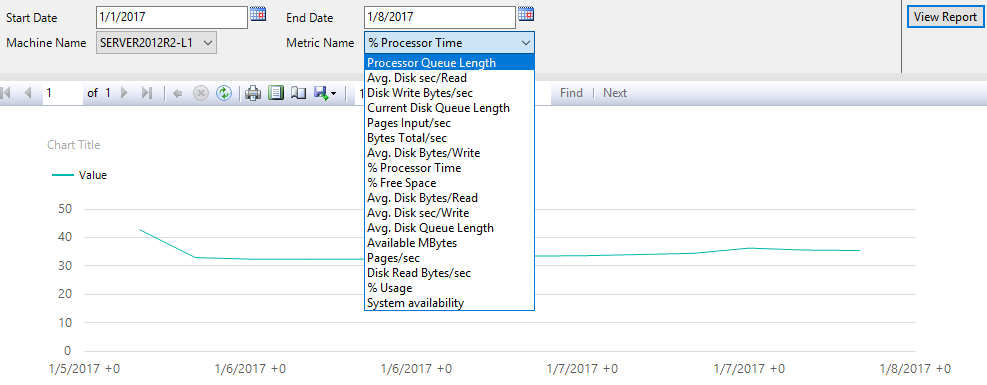
Report on a single System metric
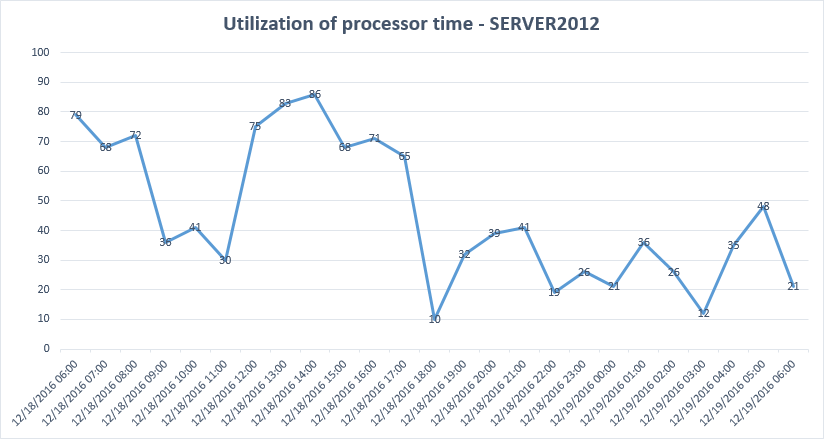
Description: This report displays a particular System metric value on a time basis, over a period of time specified by the user. The presented example is for displaying the % processor time metric, but it can be used for any other system metric by editing this section
ApexSQL.MetricNameToId('% Processor Time'), --Replace ‘% Processor Time’ with another system metric or use as parameter in application
The included .rdl file for this report is already designed to allow full customization. The user just has to select the start date and end date using the offered date/time picker, and the metric name from the drop down list of available metrics. Therefore, no user intervention is needed in sense of altering the T-SQL for customization
Inputs:
Definition:
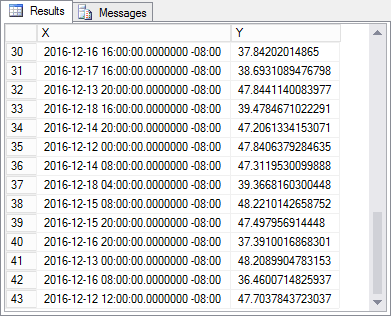
-- Set the time range (this is just an example, and this part of query will be replaced when using in reporting application or SSRS with the parameters that will be feed directly from the application/SSRS)
---------------------------------------------------------------------
DECLARE @StartDate DATETIMEOFFSET(7);
DECLARE @EndDate DATETIMEOFFSET(7);
DECLARE @ServerName NVARCHAR(256);
DECLARE @MachineName NVARCHAR(256);

SET @StartDate = '2016-12-18 06:00:00.0000000 +01:00' -- Enter the report start date/time
SET @EndDate = '2016-12-19 06:00:00.0000000 +01:00' -- Enter the report end date/time
SET @MachineName = '<machine name>' -- Enter machine/computer name

-- The main part of the script. Returns the X(Time),Y(Value) table for specific source and metric
---------------------------------------------------------------------
SELECT X
	,Y
FROM [ApexSQL].[MeasuredValueLineChart](ApexSQL.SourceNameToId(@MachineName), ApexSQL.MetricNameToId('% Processor Time'), -- Replace ‘% Processor Time’ with another system metric or use as parameter in application
		@StartDate, @EndDate, 0)
ORDER BY X
Outputs:
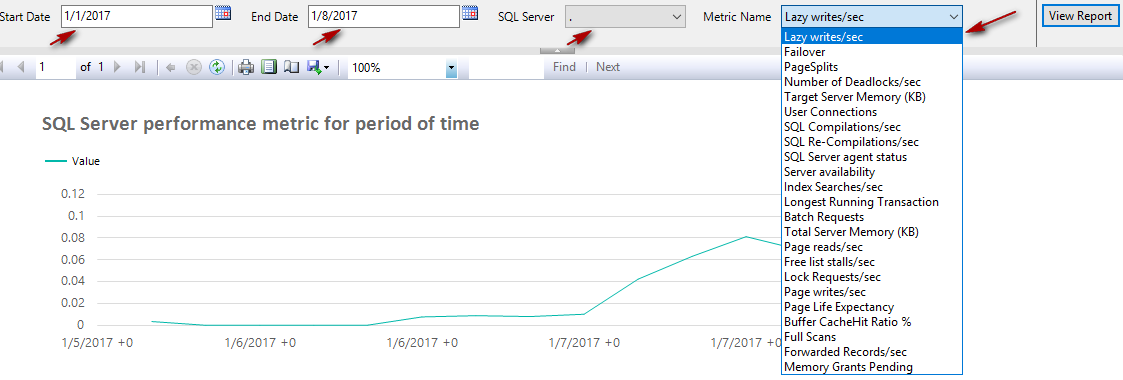
Report on a single SQL Server metric
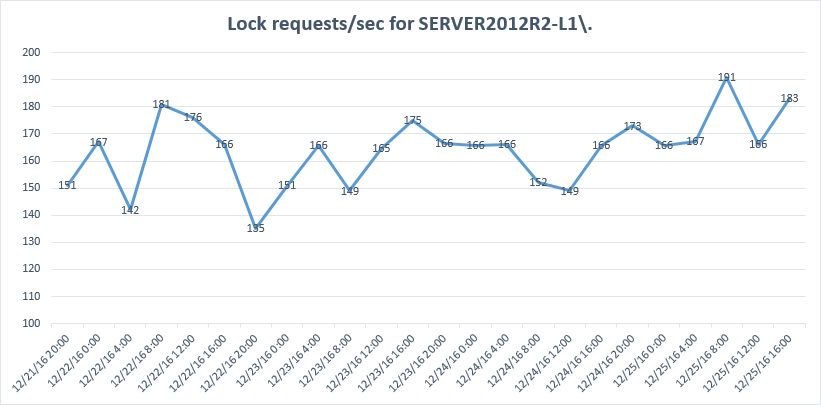
Description: This report is similar to the previous just displays a particular SQL Server metric value. Example is for the Lazy writes/sec metric, and as in the previous it can be used for any other SQL Server metric by editing the name of the metric in the query
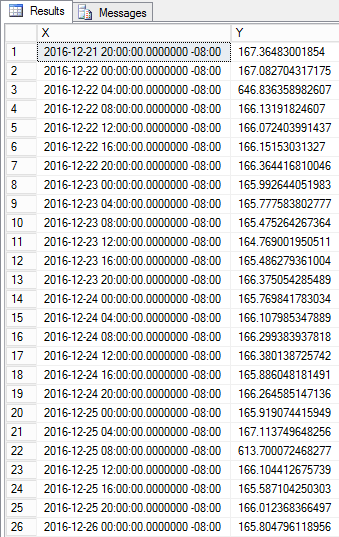
ApexSQL.MetricNameToId('Lock requests/sec'), -- Replace ‘Lazy writes/sec’ with another system metric or use as parameter in application
For SSRS users, the same is valid as for previous report as report included with this article allows full customization
Inputs:
Definition:
-- Set the time range (this is just an example, and this part of query will be replaced when using in reporting application or SSRS with the parameters that will be feed directly from the application/SSRS)
---------------------------------------------------------------------
DECLARE @StartDate DATETIMEOFFSET(7);
DECLARE @EndDate DATETIMEOFFSET(7);
DECLARE @ServerName NVARCHAR(256);
DECLARE @MachineName NVARCHAR(256);

SET @StartDate = '2016-12-18 06:00:00.0000000 +01:00' -- Enter the report start date/time
SET @EndDate = '2016-12-19 06:00:00.0000000 +01:00' -- Enter the report end date/time
SET @ServerName = '<SQL Server name>' -- Enter SQL Server name

-- The main part of the script. Returns the X(Time), Y(Value) table for specific source and metric
---------------------------------------------------------------------
SELECT X
	,Y
FROM [ApexSQL].[MeasuredValueLineChart](ApexSQL.SourceNameToId(@ServerName), ApexSQL.MetricNameToId('Lock requests/sec'), -- Replace ‘Lazy writes/sec’ with another SQL Server metric or use as parameter in application
		@StartDate, @EndDate, 0)
ORDER BY X
Outputs:
Report on multiple metrics in a single chart
SQL Server metrics report
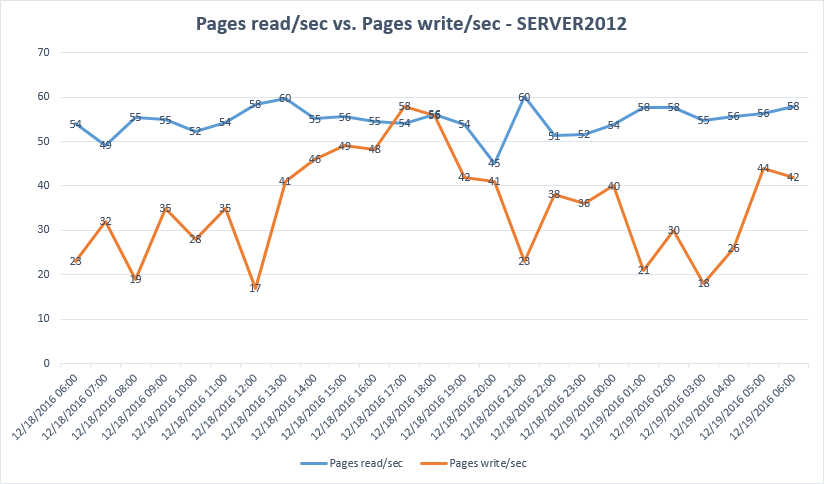
Description: This particular example shows the two-line chart with Page writes/sec and Page read/sec metrics. It is particularly useful when the need for direct comparison between two correlated metrics is required
This particular report displays the “Page writes/sec” and “'Page reads/sec'” SQL Server metrics, but it can be used for any other SQL Server metric by changing the metric names in the T-SQL directly, as shown below)
ApexSQL.MetricNameToId('Page writes/sec'), -- Enter first SQL Server metric name
Via SSRS, the metric can be changed by changing the metric name, selected in the reporting application directly.
For SSRS users, the two .rdl files are provided, one for the system metrics and one for SQL Server metrics. Both .rdl files allow full customization of report out of the box; beside selecting the start and end report date using the offered date/time picker, metrics can be selected from the drop down lists of available metrics, so no need to edit any of the underlying code
Inputs:
Definition:
-- Set the time range (this is just an example, and this part of query will be replaced when using in reporting application or SSRS with the parameters that will be feed directly from the application/SSRS)
---------------------------------------------------------------------
DECLARE @StartDate DATETIMEOFFSET(7);
DECLARE @EndDate DATETIMEOFFSET(7);
DECLARE @ServerName NVARCHAR(256);
DECLARE @MachineName NVARCHAR(256);

SET @StartDate = '2016-12-18 06:00:00.0000000 +01:00' -- Enter the report start date/time
SET @EndDate = '2016-12-19 06:00:00.0000000 +01:00' -- Enter the report end date/time
SET @ServerName = '<SQL Server name>' -- Enter SQL Server name
SET @MachineName = '<machine name>' -- Enter machine/computer name

-- The main part of the script. Returns the X(Time), Y(Value), Serie(Metric name) for specific source and SQL Server metrics. Useful for multiline charts
---------------------------------------------------------------------
SELECT X
	,Y
	,Serie
FROM [ApexSQL].[MeasuredValueMultiLineChart](ApexSQL.SourceNameToId(@ServerName), ApexSQL.MetricNameToId('Page writes/sec'), -- Enter first SQL Server metric name
		@StartDate, @EndDate, 0)

UNION ALL

SELECT X
	,Y
	,Serie
FROM [ApexSQL].[MeasuredValueMultiLineChart](ApexSQL.SourceNameToId(@ServerName), ApexSQL.MetricNameToId('Page reads/sec'), -- Enter Second SQL Server metric name
		@StartDate, @EndDate, 0)
Outputs:
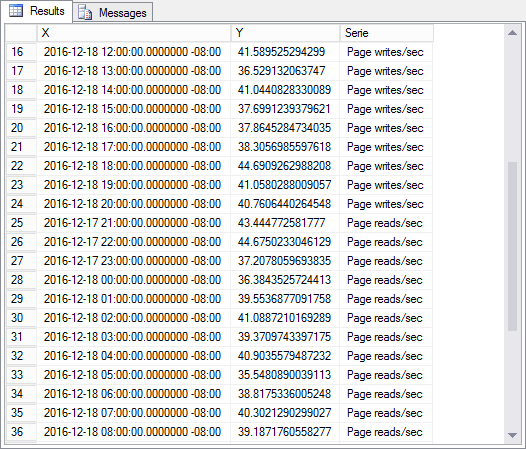
Result of the query above will return not just X and Y value needed for the chart, but also the name of the metric for each result which allows creating two series in the chart
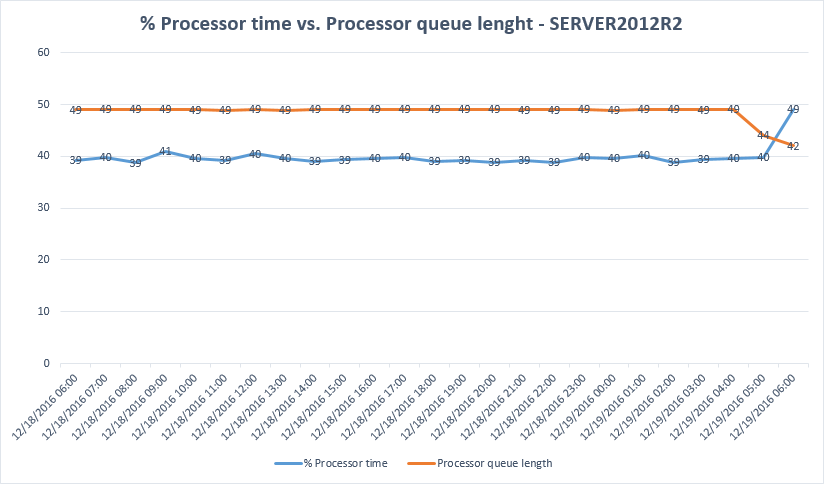
System metrics report
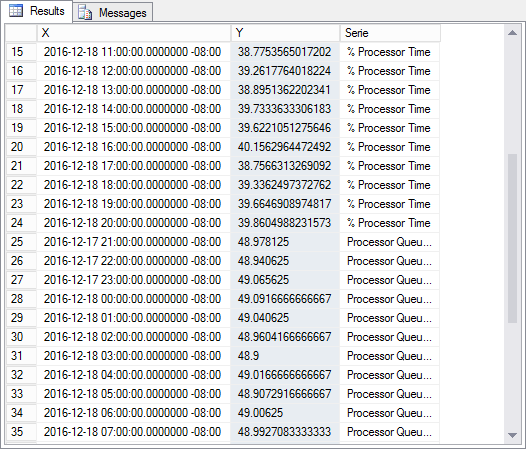
For creating the two-line chart using system metrics, use the T-SQL below. This particular report displays the % Processor time and Processor queue length metrics. The same valid for the previous report is valid here – query as is designed for use in the report application, while .rdl file that accompanies this report already allows full user customization, simply by selecting from the list of offered report parameters
Inputs:
Definition:
-- Set the time range (this is just an example, and this part of query will be replaced when using in reporting application or SSRS with the parameters that will be feed directly from the application/SSRS)
---------------------------------------------------------------------
DECLARE @StartDate DATETIMEOFFSET(7);
DECLARE @EndDate DATETIMEOFFSET(7);
DECLARE @ServerName NVARCHAR(256);
DECLARE @MachineName NVARCHAR(256);

SET @StartDate = '2016-12-18 06:00:00.0000000 +01:00' -- Enter the report start date/time
SET @EndDate = '2016-12-19 06:00:00.0000000 +01:00' -- Enter the report end date/time
SET @ServerName = '<SQL Server name>' -- Enter SQL Server name
SET @MachineName = '<machine name>' -- Enter machine/computer name

-- The main part of the script. Returns the X(Time), Y(Value), Serie(Metric name) for specific source and system metrics. Useful for multiline charts
---------------------------------------------------------------------
SELECT X
	,Y
	,Serie
FROM [ApexSQL].[MeasuredValueMultiLineChart](ApexSQL.SourceNameToId(@MachineName), ApexSQL.MetricNameToId('% Processor time'), -- Enter first system metric name
		@StartDate, @EndDate, 0)

UNION ALL

SELECT X
	,Y
	,Serie
FROM [ApexSQL].[MeasuredValueMultiLineChart](ApexSQL.SourceNameToId(@ServerName), ApexSQL.MetricNameToId('Processor queue length'), -- Enter second system metric name
		@StartDate, @EndDate, 0)
Outputs:
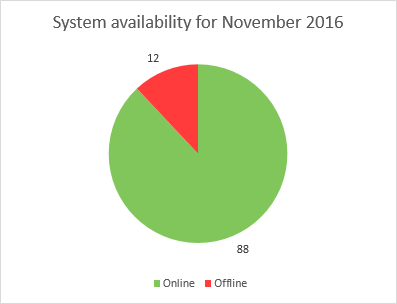
The statistical report on the System availability status - Returns the X(Type), Y(Value) table
This report is useful for presenting the system availability status metrics states statistic over the period of time, which is usually in the pie chart form. The below report displays the System availability for November 2016
Again, the .rdl file that accompanies this report is fully customizable and allows user parameter selection from drop down lists of offered parameters

Inputs:
Definition:
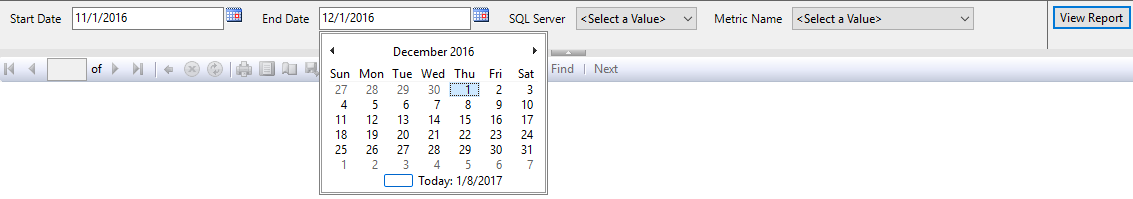
-- Set the time range (this is just an example, and this part of query will be replaced when using in reporting application or SSRS with the parameters that will be feed directly from the application/SSRS)
---------------------------------------------------------------------
DECLARE @StartDate DATETIMEOFFSET(7);
DECLARE @EndDate DATETIMEOFFSET(7);
DECLARE @ServerName NVARCHAR(256);
DECLARE @MachineName NVARCHAR(256);

SET @StartDate = '2016-11-01 00:00:00.0000000 +01:00' -- Enter the report start date/time
SET @EndDate = '2016-12-01 00:00:00.0000000 +01:00' -- Enter the report end date/time
SET @MachineName = '<machine name>' -- Enter machine/computer name

-- This is the main part of the script that returns the X(Status), Y(Value) table.
-- It is useful for status metrics with two states e.g. system availability status
---------------------------------------------------------------------
SELECT ApexSQL.StatusConverter(X) AS STATUS
	,Y
FROM [ApexSQL].[MeasuredValuePieChart](ApexSQL.SourceNameToId(@MachineName), ApexSQL.MetricNameToId('System availability'), @StartDate, @EndDate)
The statistical report on the SQL Server availability status - Returns the X(Type), Y(Value) table
This is the report related to the previous System availability example. Having System availability offline doesn’t mean that the SQL Server hosted on that machine is not online (machine might be unavailable due to network blackout to ApexSQL Monitor, but available to other machines) so it is important to track the SQL Server availability as well. Having statistics on both, system and server status is useful to keep the proper perception about what could be the potential issue if offline states are present. The below displays the SQL Server availability for November 2016
The adequate .rdl report is included and is fully customizable

Inputs:
Definition:
-- Set the time range (this is just an example, and this part of query will be replaced when using in reporting application or SSRS with the parameters that will be feed directly from the application/SSRS)
---------------------------------------------------------------------
DECLARE @StartDate DATETIMEOFFSET(7);
DECLARE @EndDate DATETIMEOFFSET(7);
DECLARE @ServerName NVARCHAR(256);
DECLARE @MachineName NVARCHAR(256);

SET @StartDate = '2016-11-01 00:00:00.0000000 +01:00'
SET @EndDate = '2016-12-01 00:00:00.0000000 +01:00'
SET @ServerName = '<SQL Server name>' -- Enter SQL Server name

-- This is the main part of the script that returns the X(Type), Y(Value) table.
-- It is useful for status metrics with two states e.g. SQL Server availability status
---------------------------------------------------------------------
SELECT ApexSQL.StatusConverter(X) AS STATUS
	,Y
FROM [ApexSQL].[MeasuredValuePieChart](ApexSQL.SourceNameToId(@ServerName), ApexSQL.MetricNameToId('Server availability'), @StartDat
