A typical virtual environment contains a set of ESX® host and virtual machines. An ESX host can be a part of a cluster, and can have one or more virtual machines associated with it. Other components of a Virtual Center include datacenters, resource pools, vApp, and data stores. You can view the overall state of these components on the VMware Environment dashboard.
When you navigate to the VMware Environment dashboard for the first time, the Monitoring tab appears open. This tab provides an overall summary of your virtual environment. Other tabs are also available. This topic describes the Monitoring tab. For information about other tabs, see the following topics:
|
• |
|
• |
The VMware Environment dashboard is made up of the following views: the Virtual Environment Overview and Quick-View. Selecting an object type and its alarm state in the Virtual Environment Overview shows the summary information for your selection in the Quick-View. For reference information about the data appearing on this dashboard, see VMware Environment views .
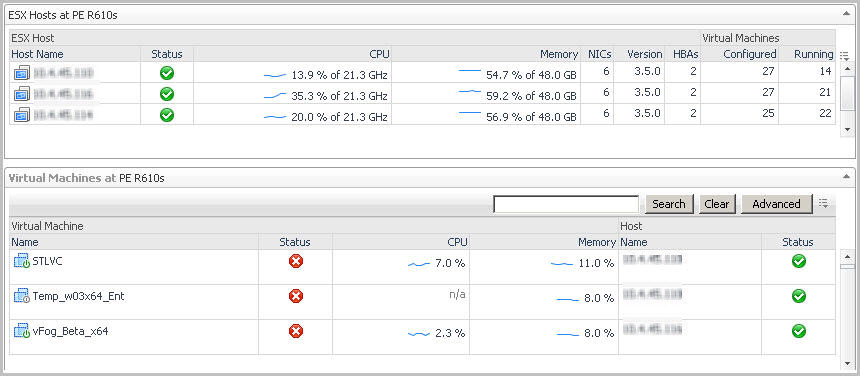
In the example below, the ESX Hosts tile is selected. The ESX Hosts view is populated with all monitored ESX Hosts regardless of their alarm state. Summary information for those ESX Hosts appears in the ESX Host Summary view.
The VMware Environment dashboard contains the FAQts tab that you can use to ask questions about your monitored systems and review the answers. In the Categories pane, the FAQts view shows several question categories. Clicking a category shows the questions belonging to that category in the Questions pane. From there, clicking a question shows the answer on the right.
For reference information about this view, see FAQts tab .
|
NOTE: The VMware Explorer dashboard is inventory-based. The VMware Explorer dashboard counts all virtual machines (VMs), including template VMs, for each vCenter. The Virtual Environment Summary dashboard is service-based. The VMware service created by Foglight® for VMware for a particular vCenter does not contain template VMs. Therefore, the number of VMs for a particular vCenter is different when you view it through the VMware Explorer dashboard than the number that appears when you view it through the Virtual Environment Summary dashboard. |
To access this dashboard, from the navigation panel, under Dashboards, click VMware > VMware Explorer. For complete reference about the data appearing on this dashboard, see VMware Explorer views .
The VMware Explorer dashboard contains the following views: the Virtual Infrastructure view and VMware Explorer Primary view.
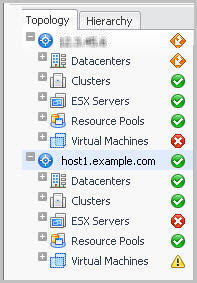
The Virtual Infrastructure view contains a navigation tree on the Topology tab that represents the various virtual infrastructure objects: Virtual Centers, Datacenters, Clusters, ESX Hosts, Resource Pools, and Virtual Machines. For each individual object or group of objects, a status indicator appears, showing the alarm of highest severity that is outstanding for the that object or objects. For example, there are 25 virtual machines configured for a vCenter. Twenty of the virtual machines have a normal status, three have a warning status, and two have a critical status. In the Topology view, the virtual machines container for that vCenter displays a critical status indicator to show that at least one of the virtual machines associated with the vCenter has an outstanding critical alarm.
The Hierarchy tab shows the logical layout of vCenter management servers.
Hovering over an object in the Virtual Infrastructure view, you see a popup that provides a summary of the present state of that object.
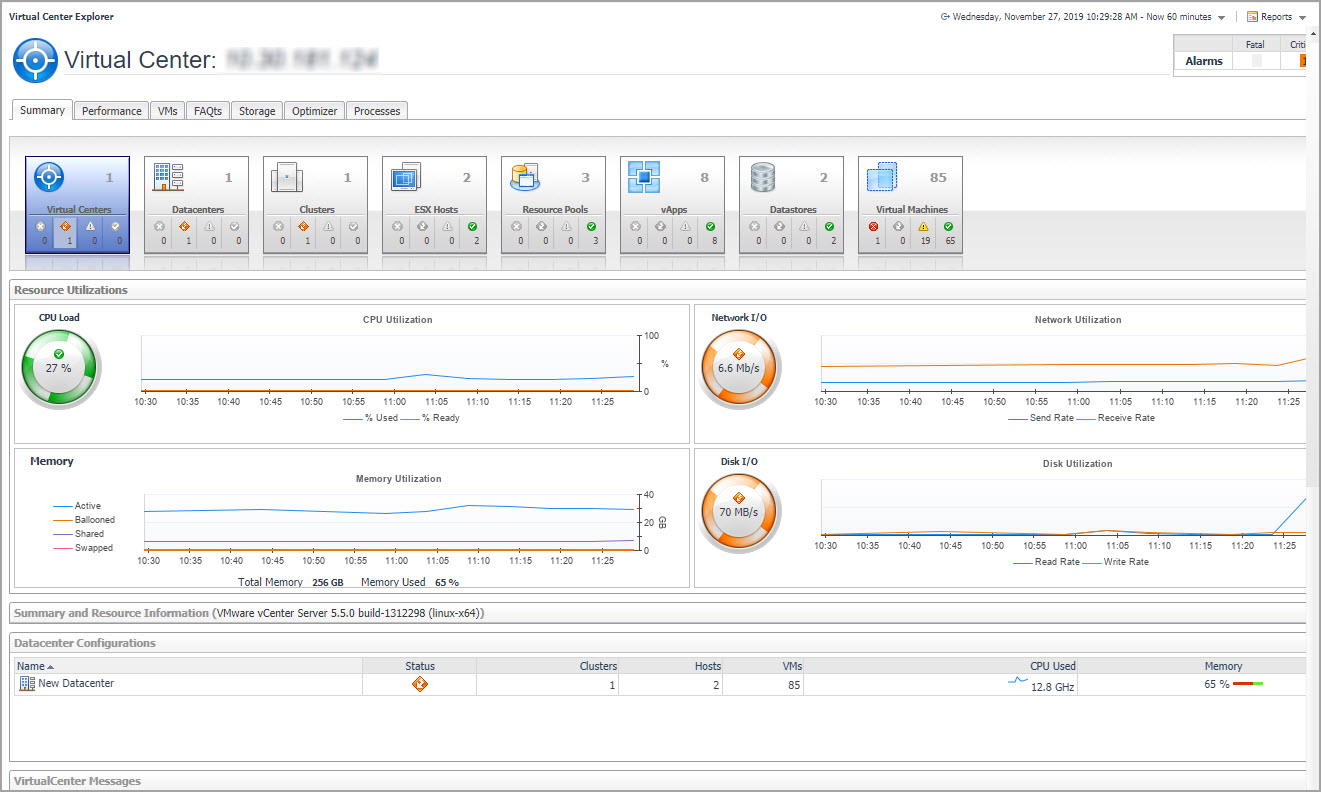
Selecting an object or group of objects on either tab of the Virtual Infrastructure view displays performance details about your selection in the VMware Explorer Primary view. The VMware Explorer Primary view takes up the entire display area of the Foglight for VMware browser interface. This view provides significant value to administrators who leverage Foglight for VMware to monitor their virtual infrastructure.
Selecting an object or group of objects on either tab of the Virtual Infrastructure view displays performance details about your selection in the VMware Explorer Primary view. The VMware Explorer Primary view takes up the entire display area of the Foglight for VMware browser interface. This view provides significant value to administrators who leverage Foglight for VMware to monitor their virtual infrastructure.
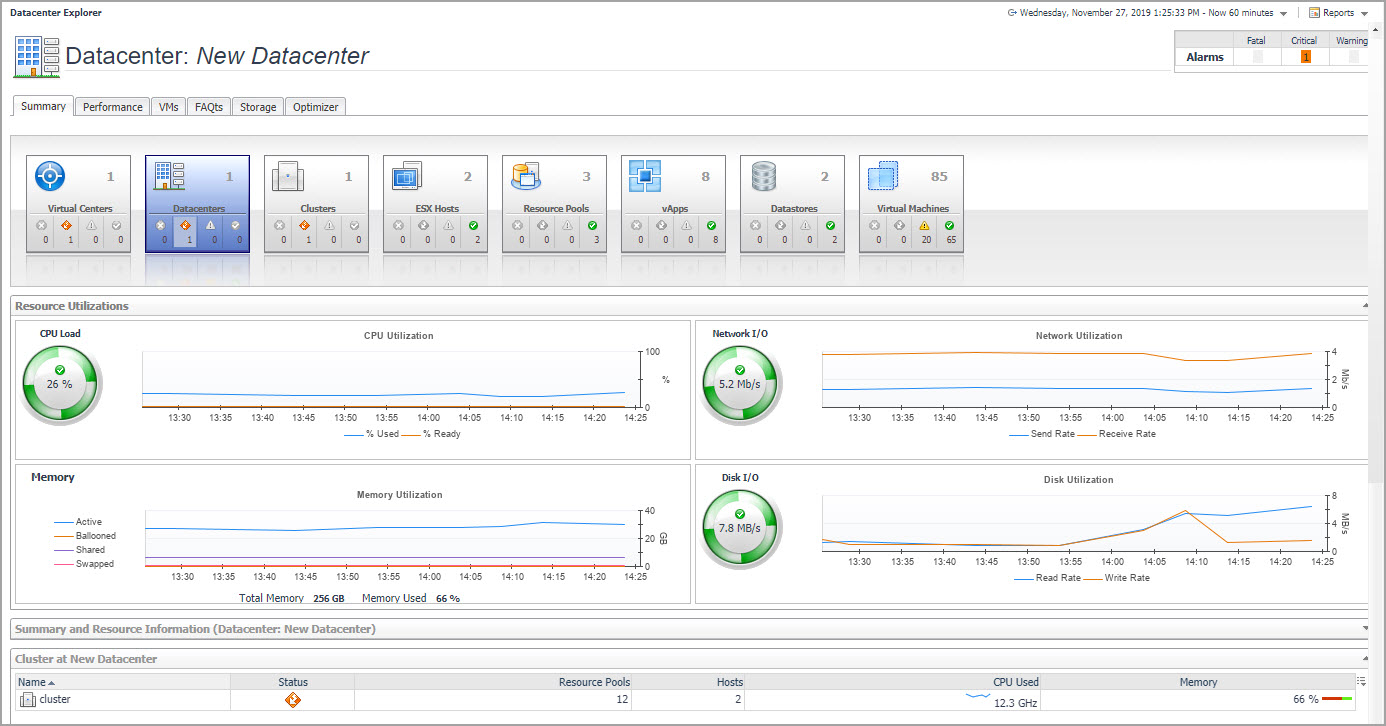
The metrics and the amount of detail displayed in the display area vary depending on the type of the selected object. For example, in the image below, the tiles indicate that the selected object is the New Datacenter datacenter, and that it is connected to one vCenter, one cluster, two ESX® Hosts, and so on.
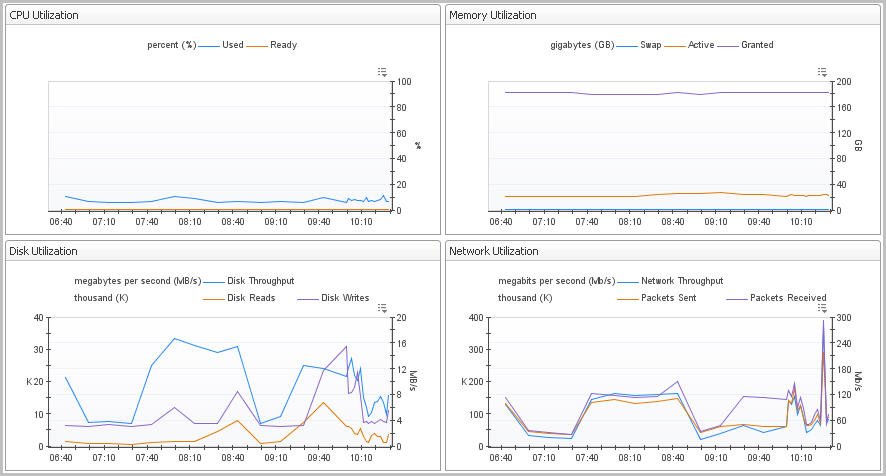
The Utilizations view, typically located across the center of the display area tab, provides numerical and graphical representations of utilization metrics associated with the selected object or group of objects. For example, selecting a single resource pool from the Virtual Infrastructure view and opening the Performance tab in the display area, displays four graphs in the Utilizations view, showing CPU, memory, disk, and network resource utilizations for the selected resource pool.
If you open the VMs tab for that same resource pool, the Utilizations view displays one graph illustrating the percent-used and percent-ready CPU utilization for the virtual machines of the resource pool.
If, however, you select a collection of ESX Hosts from the Virtual Infrastructure view and you open the Summary tab, an informative graph appears in place of a Utilizations view. Selecting a collection of objects in the Virtual Infrastructure view always shows a composite view displaying information about all object instances contained in that collection.
In addition to the Utilizations view, one or more Related Objects views may appear at the bottom of the display area. These views take the form of tables and list either the parent or child objects or both (whichever are applicable) of the object being viewed, and provide pertinent details about each one. Their appearance depends on the type and range of objects selected in the Virtual Infrastructure view.
However, when you select a cluster container, the Summary tab shows a Related Objects view that lists all of the clusters in that container and provides pertinent details about each one.
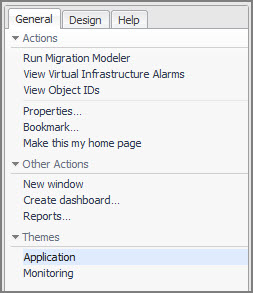
The following image shows an example of a typical VMware Explorer dashboard action panel.
For more information on the Migration Modeler, including specific instructions on how to run the Migration Modeler, see Planning for virtual machine migrations .
Under the Actions heading, the View Virtual Infrastructure Alarms link takes you to the vmAlarms dashboard. For specific information on the vmAlarms dashboard, see Exploring VMware alarms .
To narrow down the list of objects, type a relevant text string in the search field provided and click Search. You can type things like a portion of the object type name (for example, server), a portion of the object name (for example, part of the IP address), or a portion of the object ID. To clear the Search box, click Clear.
For more advanced search options, click Advanced. To narrow down the list to objects of a particular type, type the object type name in the Type box. To find the object by name, type the object name in the Name box. To find the object by ID, type the object ID in the Object ID field.