Chat now with support
Chat with Support

Foglight for VMware 5.8.3 - User Guide (Lite version)

Using VMware Monitoring in Foglight Evolve Cloud Reference Appendix: Alarm Messages Appendix: Metrics

Views

VMware Monitoring in Foglight® Evolve Cloud ships with predefined views to help you monitor your application server environment. This provides quick reference information about each view.

VMware Monitoring in Foglight Evolve Cloud displays monitoring data in views that group, format, and display data. The main types are described below.

Dashboards are top-level views that do not receive data from other views. Dashboards usually contain a number of lower-level views. The dashboards supplied with VMware Monitoring in Foglight Evolve Cloud, as well as those created by users, are available in the navigation panel.

Lower-level views in VMware Monitoring in Foglight Evolve Cloud can be added to dashboards or can be accessed by drilling down from a dashboard. They receive and display data directly from the VMware Monitoring in Foglight Evolve Cloud Management Server or from other views. Some views filter or select data that appears in other views in the same dashboard. Some are tree views with expandable nodes for selecting servers, applications, or data.

VMware Monitoring in Foglight Evolve Cloud ships with several dashboards that allow you to monitor and configure your virtual environment. Each of these dashboards contains a number of views. This section describes these views in more detail. For more information about the VMware dashboards, see Interacting with VMware Monitoring in Foglight Evolve Cloud.

VMware Monitoring in Foglight Evolve Cloud includes the following groups of views:

VMware Explorer views

The VMware Explorer dashboard contains the following views:

FAQts tab

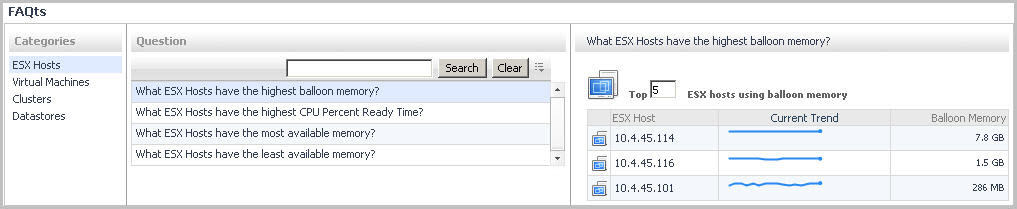
Through three embedded views (the Categories, Question, and Answer views), the FAQts tab enables you to ask VMware Monitoring in Foglight Evolve Cloud questions and provides the answers to those questions.

Figure 59. FAQts tab

The FAQts view appears on both the Virtual Environment Summary and VMware Explorer dashboards as a navigation tab.

The FAQts view is made up of the following embedded views:

This view provides an answer to the question selected in the Questions view. The answer appears in the following form:

Top x <objects of category>…

where x is the number of objects of the category you provided in the Categories view.

Specify x by entering a number. The answer is relative to the subset of the infrastructure you are viewing in the dashboard. For example, the top 5 datastores are different for each individual cluster in the infrastructure.

This view lists the categories for which questions can be answered for you by VMware Monitoring in Foglight Evolve Cloud.

Click a category in the list to select it.

This view lists the questions, for the category selected in the Categories, that can be answered for you by VMware Monitoring in Foglight Evolve Cloud.

Click a question in the list to select it.

If the list of questions is long and you want to narrow it down, search for a particular text string using the Search box.

Resource Pools Relationship Tree view

The Resource Pools Relationship Tree view is provided in the VMware Explorer dashboard. If you select a Resource Pool container from the Topology view on the Virtual Infrastructure view and click the Summary navigation tab within the VMware Explorer Primary view, a Resource Pools Relationship Tree view is displayed in the Primary view. A Resource Pools Relationship Tree contains every resource pool that belongs to the clusters within the associated VirtualCenter.

For more information about the VMware Explorer dashboard, see Investigating performance metrics .

The Resource Pools Relationship Tree view is useful if you want to see how the resource pools within the clusters are laid out or if you want to take a look at the utilization statistics for each configured resource pool on the VirtualCenter.

The default Resource Pools Relationship Tree simply displays the names of the various resource pools and their parent/child relationships.

You can use the Normal Zoom Level button on the mini map at the top right of the Relationship Tree to zoom into a more detailed version of the Tree. You can use the Minimized Zoom Level button on the mini map to zoom back out again.

You can browse through a Relationship Tree by clicking and dragging the rectangular shadow provided on the mini map.

Related Documents

The document was helpful.

Select Rating

I easily found the information I needed.

Select Rating