Chat now with support
Chat with Support

Foglight for VMware Horizon View 6.0.0 - User Guide

Manage desktops in virtual environments Interact with Foglight for VMware Horizon View dashboards Reference

Reference

This section contains reference information about views that are included with Foglight for VMware Horizon View. Read this section to find out details about these components: Views.

Views

Foglight for Hyper-V ships with predefined views to help you monitor your application server environment. This section provides quick reference information about each view.

Foglight for Hyper-V displays monitoring data in views that group, format, and display data. The main types are described below.

Dashboards are top-level views that do not receive data from other views. Dashboards usually contain a number of lower-level views. The dashboards supplied with Foglight for Hyper-V, as well as those created by users, are available in the navigational panel.

Lower-level views in Foglight for Hyper-V can be added to dashboards or can be accessed by drilling down from a dashboard. They receive and display data directly from the Management Server or from other views. Some views filter or select data that appears in other views in the same dashboard. Some are tree views with expandable nodes for selecting servers, applications, or data.

Foglight for VMware Horizon View ships with several dashboards that allow you to monitor and configure your virtual environment. Each of these dashboards contains a number of views. This section describes these views in more detail. For more information about the dashboards, see Interact with Foglight for VMware Horizon View dashboards.

Foglight for VMware Horizon View includes the following views:

Action panel

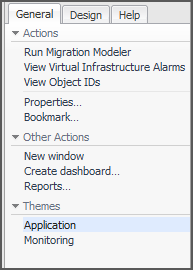
The action panel is located at the far right of the Foglight for Hyper-V browser interface.

The action panel provides you with easy access to a number of useful actions and tasks. However, it only provides additional related actions when you are viewing the VMware Explorer dashboard.

The actions available in the action panel vary depending on the object displayed in the VMware Explorer dashboard.

The following image shows an example of a typical VMware Explorer dashboard action panel.

Under Actions, the action panel may provide the following additional related actions:

Administration tab

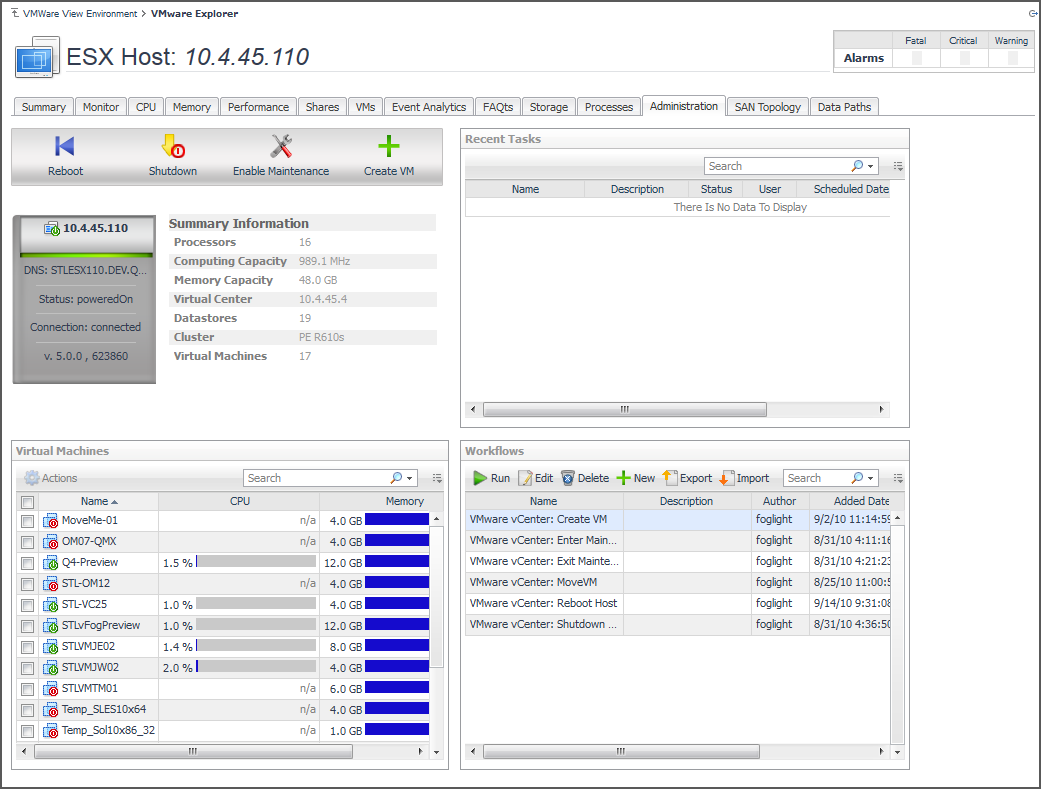
This tab is available in the VMware Explorer. To find it, open the VMware Explorer and on the Virtual Infrastructure view, that appears on the navigation panel, select an ESX® host or virtual machine instance. In the VMware Explorer, open the Administration tab.

The VMware Explorer’s Administration tab provides access to common administrative tasks. It also shows configuration details for a server or a virtual machine (depending on the selected object type), and some high-level information about the object’s resource consumption.

This view is made up of the following embedded views:

This table lists the tasks that are performed for the selected ESX® host or virtual machine. For each task, it shows its description, the date on which the task finished, the task name, the date on which the task is scheduled to run, the task status, and the Foglight user who started the task.

Shows physical configuration details for the selected ESX® host.

This view displays additional configuration details for the selected ESX® host. It shows the name of the domain the selected ESX host belongs to, the ESX host's IP address, the total amount of memory, the number of CPUs, the processor type, the length of time the ESX host is running, and the number of virtual machines running on that host.

This toolbar contains buttons for initiating common administrative tasks, such as rebooting and shutting down the ESX® host, enabling its maintenance, and creating virtual machines.

This view contains a hierarchical view of the selected virtual machine’s snapshots. It also contains buttons for initiating common administrative tasks such as creating, deleting, renaming, and reverting to virtual machine snapshots.

This view shows the name of the selected virtual machine and its basic configuration, including its status, machine name, configuration, virtualization application (VMware®), and the guest OS.

This view shows a list of virtual machines associated with the selected ESX® host. For each virtual machine, it displays its name, the total amount of memory that is available to that virtual machine, and the current percentage of time the CPU allocated to the virtual machine executes system code and user programs, including both system and user time.

This view shows additional configuration details for the selected virtual machine. For each virtual machine, it displays its IP address, OS name, the number of CPUs and network interface cards used by that virtual machine, the amount of memory and disk storage allocated to the virtual machine, the services associated with the selected virtual machine, and the length of time the virtual machine is running.

This toolbar contains buttons for initiating common administrative tasks, such as powering off the virtual machine, shutting down its guest OS, rebooting, suspending, switching the guest OS to standby mode, deleting, moving, and editing virtual machine configurations.

This view contains a list of the available workflows along with buttons for creating and editing workflows. A workflow is a collection of tasks that are arranged into a specific order, that you can run multiple times against the same or different set of objects. It provides a way to automate common scenarios and simplify administration in general. For each workflow, this view contains its name and description, the dates on which the workflow was added and updated, and the name of the Foglight user who created the workflow. You can use this view to create, edit, delete, and run workflows, and to import or export them to a file.

Related Documents

The document was helpful.

Select Rating

I easily found the information I needed.

Select Rating