|
 |
Managing database groups
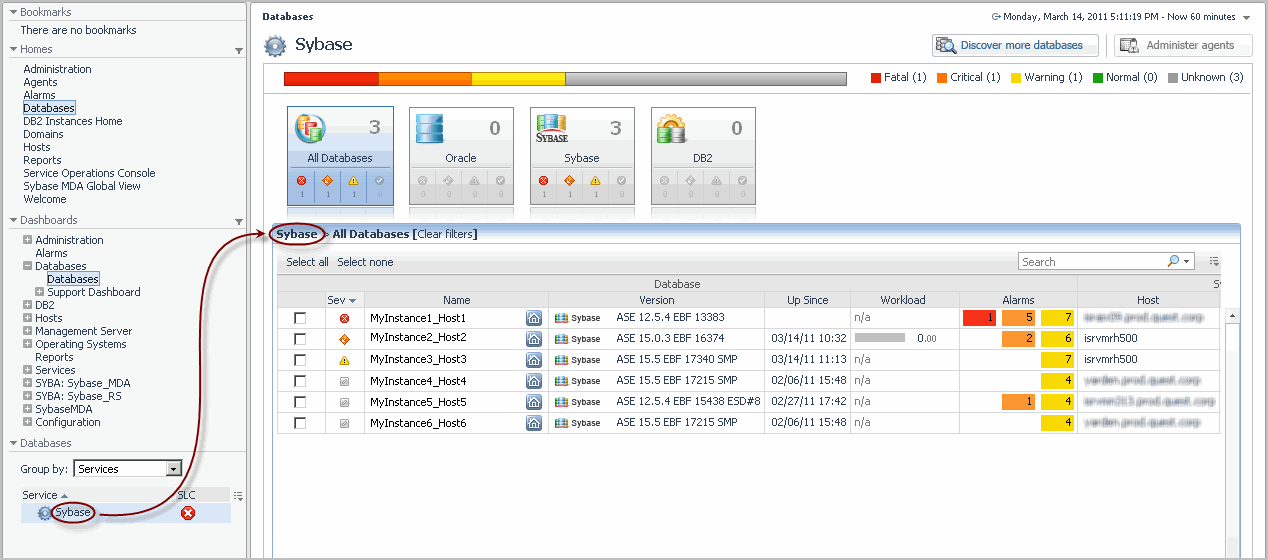
In large monitored environments that include a high number of database instances it might be useful to create separate groups of database instances that share some common attributes, and to monitor the individual groups separately. Using the Databases view on the navigation panel, it is possible to group database instances either by identifying specific database instances, or services that contain specific database objects, and adding them to the group. This view allows you to create, edit, and remove database groups, thereby serving as a filter for the list of database instances.
To filter the list of databases by selecting services:
The Databases view refreshes, showing groups of monitored resources created using the Service Builder dashboard, and containing the Foglight for Sybase database topology. The SLC column, also appearing in this view, indicates the current availability of each service over a given period of time.
Figure 44. Selected Services
To create a database sub-group:
The Add Sub Group dialog box appears.
to move them to the Selected list.
Alternatively, click
to select all of the databases instances.
The sub-group name appears in the list and the database instances you selected in Step 3 appear in the list of databases.
To manage database groups:
| |
|
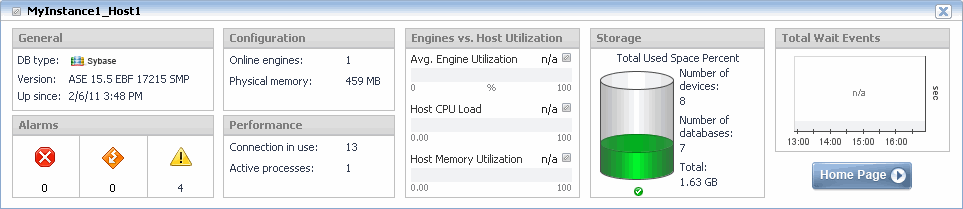
Exploring the state of selected database instances
Figure 45. Cue Card details
The cue card displays the following information.
| |
|
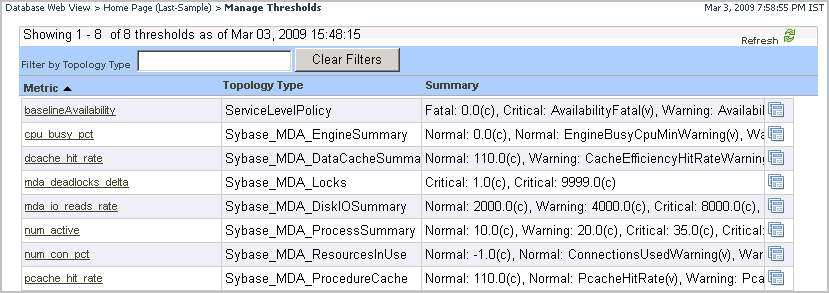
Manage Thresholds Dashboard
The Manage Thresholds dashboard provides access to the list of thresholds. A topology filter is available to search for a specific set of thresholds. For more information about this dashboard, see the Administration and Configuration Help.
Figure 46. Manage Thresholds Dashboard
Manage Thresholds Table
Table 69. Manage Thresholds Table Description
The metric threshold name. You can edit a threshold by clicking on this name.
| |
|
About the Sybase_MDA Agent