|
NOTE: This procedure is intended for Foglight for Storage Management users with the roles of Storage Administrator, VMware Administrator, and Hyper-V Administrator. |
|
1 |
Open a supported browser. For a list of supported browsers, see the System Requirements Guide. |
|
4 |
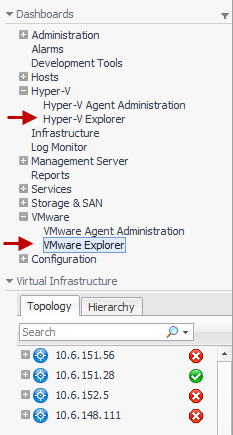
On the navigation panel, expand Dashboards. |
|
5 |
Expand Storage & SAN. |
|
6 |
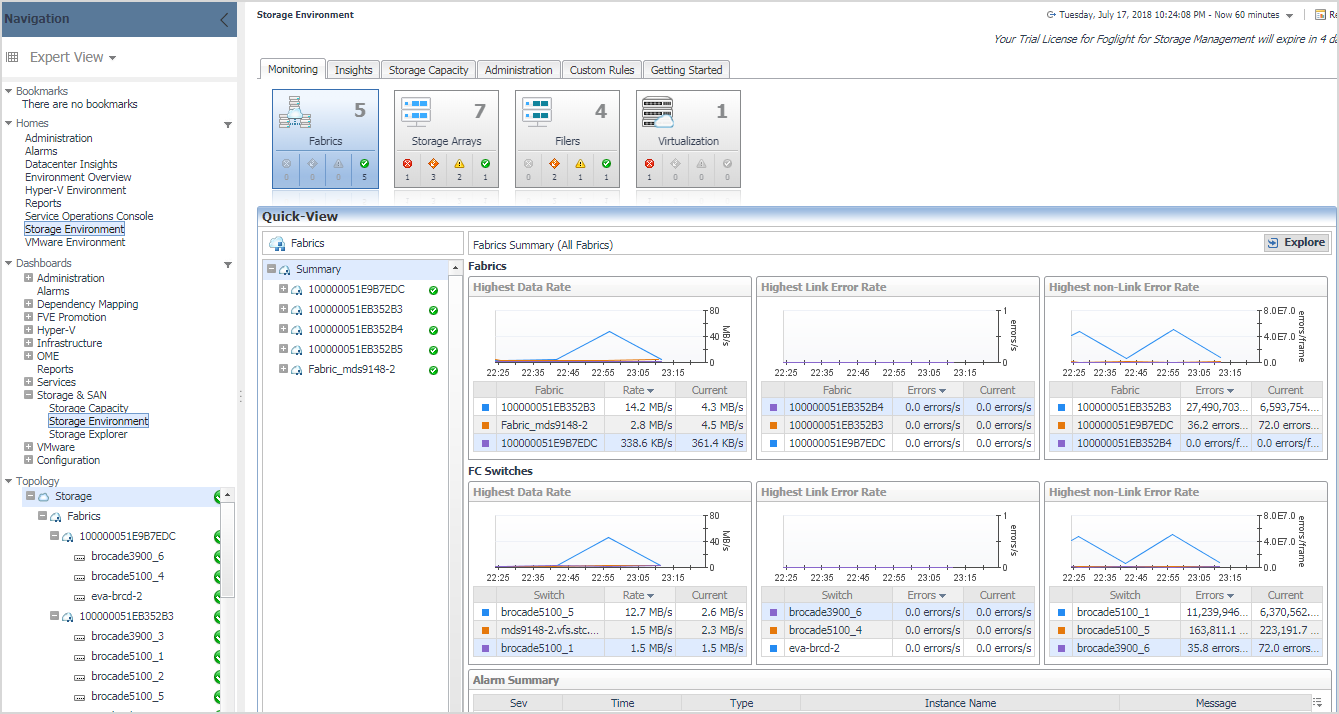
Click Storage Environment. |
|
7 |
Ensure the Monitoring tab is selected. |
|
f |
|
TIP: If you do not see the Administration tab, ask your Foglight for Storage Management Administrator to add the role Storage Administrator to your user account. |
|
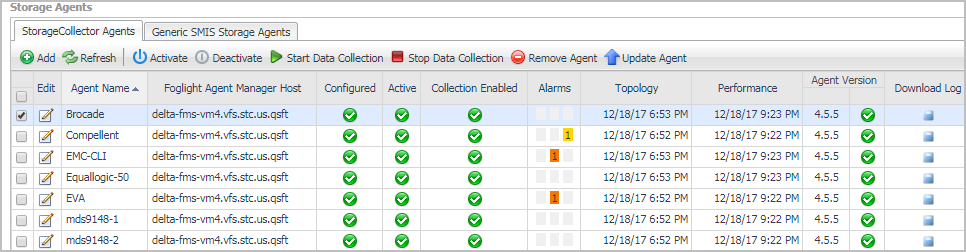
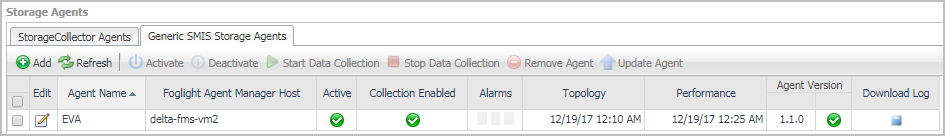
g |
In the Storage Agents > StorageCollector Agents list, look for the Storage Collector agent that monitors the missing device or device type. When an agent monitors a device type, click the Edit icon to view a list of named devices in the Edit Agent Properties dialog box. |
|
a |
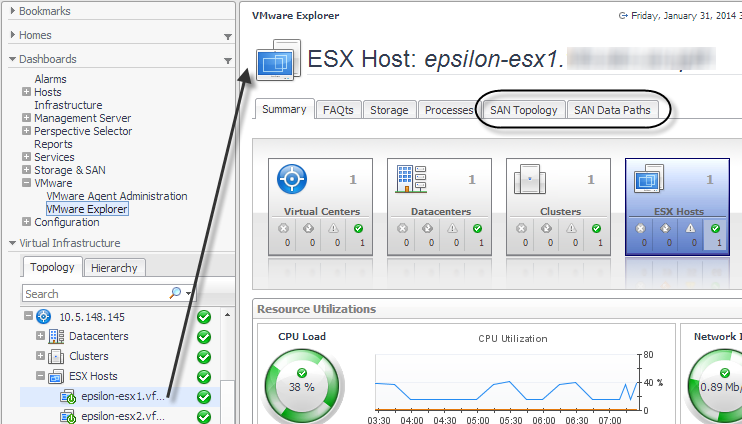
Click the Hyper-V or VMware Explorer. |
|
d |
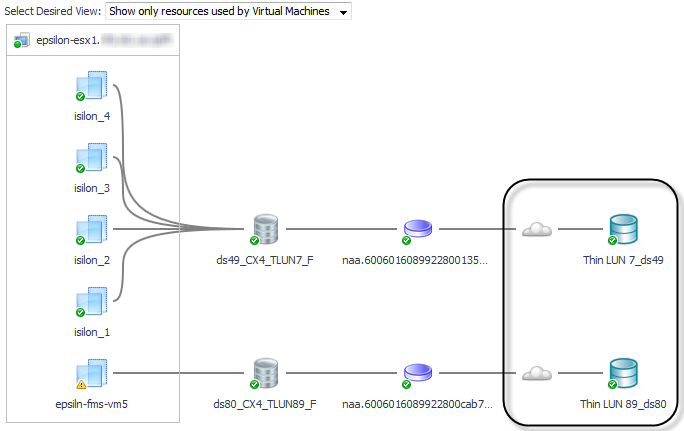
Click the SAN Topology tab. |
|
3 |
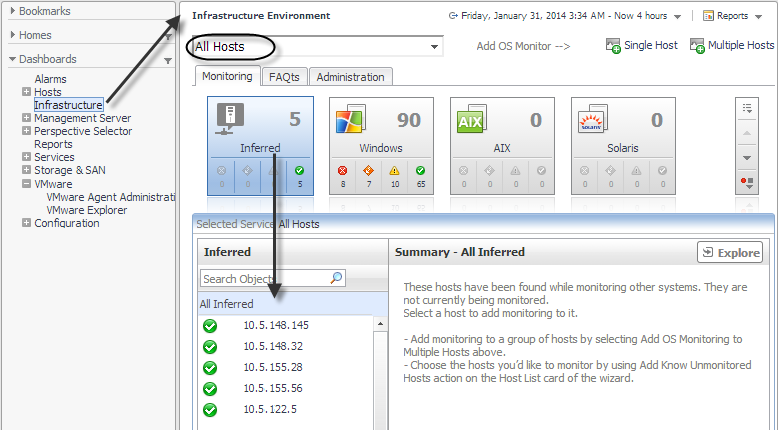
On the navigation panel, click Infrastructure. |
|
a |
In the Select a Service box, select All Hosts. |
|
b |
Click the Inferred tile. |
|
c |
In the Storage & SAN dashboards, charts and tables display metric data. Data is collected by Storage Collector agents, aggregated into collections, and the collections are published to the SAN & Storage dashboards at regular intervals. For more information about storage collection schedules and the type of data collected, see Modifying Data Collection Schedules.
|
• |
Current. The value collected in the last interval in the selected time range. In charts, the last plotted value is the current value. |
|
• |
Period. Aggregated values for the entire selected time range. Period values are often used to provide context for current values. |
|
• |
Historical. Individual values for each collection interval in the selected time period. Historical values are often presented as datapoints in a plot chart or as sparklines to show how metrics changed over the time period. |
|
• |
Latest. Values in the latest collection interval available, irrespective of the selected time range. If data collection is enabled, this value reflects the latest collection. If data collection is disabled, this value represents the last collection made by the agent. Although latest values are tracked, the SAN & Storage dashboards do not display these values. |
For indepth information about metrics, see http://communities.quest.com/docs/DOC-12862.
Values are not available (n/a) under the following circumstances:
|
• |
The device vendor does not provide the necessary metric. In this case, the text n/p by vendor appears after the metric name in column headings. |
|
• |
A device is offline (reported in the State field). |
|
Infer connections from physical hosts to storage and show the connections in topology diagrams. |
|
