Chat now with support
Chat with Support

Foglight for SQL Server (Cartridge) 5.9.5.10 - User Guide

Introduction to this Guide Using Foglight for SQL Server
Viewing the Databases Dashboard Overview Dashboard Advisories Dashboard Monitoring Data Replication Monitoring SQL Performance Reviewing Memory Usage Reviewing the Instance Activity Reviewing Database Usage Reviewing the Services Using the HADR Drilldown Using the Logs Drilldown Reviewing Configuration Settings Viewing User-defined Performance Counters and Collections
Monitoring Business Intelligence Services Administering Foglight for SQL Server
Configuration Settings Managing Foglight for SQL Server Agent Settings Reviewing Foglight for SQL Server Alarms Generating Reports Monitoring SQL Server instances on VMware servers
Glossary
A
Access methods Adhoc SQL Plans Alarm Alert Allow updates Anonymous subscription Authentication AutoClose AutoGrow Automatic Discovery AutoShrink B Batch BCP (Bulk Copy Program) Blocking Books Online Bound trees Buffer Buffer cache Buffer pool Bulk copy Bulkinsert Bulk load C Cache CAL Calibration Cardinality Cartridge Chart Checkpoint process Client network utility CLR Compile Connect Connection Connectivity software CPU Usage Cursors D Data access components Data file Data storage engine Database Database object DataFlow DBCC DBID DBO Deadlock Disk queue length Disk transfer time Disk utilization DiskPerf Distributing instance Distributor DMO Drilldown DTC DTS E Error log Event alert Execution contexts Extended stored procedures Extent External procedures F File Filegroup File cache Foglight Agent Manager Foglight Management Server Foreign key Forwarded records Free buffers Free list Free pages Free potential Free space Freespace scans Full text search G GAM Ghosted records Growth increment GUID H Hash buckets Hashing Heap Hit rate Hit ratio Host name Host process I I/O Index Indid Integrated security Intent Locks J Job K Kernel memory Kernel mode Kill L Latch Lazy writer Licensing Lightweight pooling Lock Lock area Lock escalation Lock mode Log Log cache Log writer Logical I/O LRU LSN M Master MaxSize MDAC Metric Misc.normalized trees Model Monitor page file N Named pipes Net library NIC Null O OBID Object plans OLAP OLAP service OLTP Optimizer Optimizer cache osql P Page life expectancy Paging Panel Parse Parser Per seat licensing Per server licensing Performance alert Physical I/O Physical read Physical write PID Pinned Plan Plan cache Potential growth Prepared SQL plans Primary key Privileged mode Procedure cache Procedure plans Process Profiler Publication database Publisher Publisher databases Publishing server Pull subscription Pulse Push subscription Q Query plan R RAID Random I/O Read ahead Recompile Referential integrity Relational data engine Replication procedure plans Role Rollback S sa Schema locks Sequential I/O Session Severity SGAM Shared locks Show advanced options SMP Sort, Hash, Index Area SPID Spike Spinner SQL Agent Mail SQL Mail SQL Plans SQL Server Agent SQL Server authentication SQL Server books online Standard deviation Stolen pages Stored procedure Support service SYSADMIN role T TDS TempDB Temporary tables and table variables Threshold Torn page detection Transaction Trigger Trigger plans Truncate Trusted U UMS Unused space User connection area User mode V Virtual log file VLF W Waitfor Windows authentication mode Working set
Reference
SQL PI Repository Cold Backup Procedure SQL Performance Investigator Metrics
Active Time All SQL Agents CPU Usage All SQL Agents Resident Memory Usage Availability Average Physical I/O Operations Average SQL Response Time Backup Recovery Wait Blocked Lock Requests Checkpoint Pages CLR Wait CPU Usage CPU Wait Cursor Synchronization Wait Database Replication Wait Deferred Task Worker Wait Degree of Parallelism Disk Utilization DTC CPU Usage DTC Resident Memory Usage Distributed Transaction Wait Executions Ended Executions Started External Procedures Wait Full Scans Full Text Search CPU Usage Full Text Search Resident Memory Usage Full Text Search Wait Free Buffer Wait Hosted Components Wait IO Bulk Load Wait IO Completion Wait IO Data Page Wait IO Wait Latch Buffer Wait Latch Wait Latch Savepoint Wait Lazy Writes Lock Wait Lock Bulk Update Wait Lock Exclusive Wait Lock Intent Wait Lock Requests Lock Schema Wait Lock Shared Wait Lock Update Wait Lock Wait Log Buffer Wait Log Flushes Log Other Wait Log Synchronization Wait Log Wait Log Write Wait Memory Wait Network IO Wait Network IPC Wait Network Mirror Wait Network Wait Non SQL Server CPU Usage Non SQL Resident Memory Usage OLAP CPU Usage OLAP Resident Memory Usage OLEDB Provider Full Text Wait Other CPU Usage Other Miscellaneous Wait Other Wait Overall CPU Page Life Expectancy Page Splits Parallel Coordination Wait Physical I/O Physical Memory Used Physical Page Reads Physical Page Writes Probe Scans Plan Cache Hit Rate Range Scans Rec Ended Duration Remote Provider Wait Run Queue Length Samples Service Broker Wait Session Logons Session Logoffs SQL Agent CPU Usage SQL Agent Resident Memory Usage SQL Executions SQL Mail CPU Usage SQL Mail Resident Memory Usage SQL Recompilations SQL Response Time SQL Server Background CPU Usage SQL Server Cache Memory SQL Server Connections Memory SQL Server Connections Summary SQL Server Foreground CPU Usage SQL Server Resident Memory Usage SQL Server Swap Memory Usage Synchronous Task Wait Table Lock Escalation Target Instance Memory Total CPU Usage Total Instance Memory Virtual Memory Used
Rules Collections and Metrics
SQL Server Agent's Default Collections Access Methods Agent Alert List Agent Job List Always On Availability Groups Backup Locations Blocking History Blocking List Buffer Cache List Buffer Manager CLR Assemblies Cluster Summary Configuration Database Index Density Vectors Database Index Details Database Index Fragmentation Info Database Index Histogram Database Index List Database Information Database Properties Database Sessions (Session List) Database Summary Database Tables List Databases Deadlock DTC Information Error Log Error Log List Error Log Scan File Groups File Data Flow Statistics File Groups Files Files Drive Total Files Instance Summary Full Text Catalog InMemory OLTP (XTP) Instance Wait Categories Instance Wait Events Job Messages Latches and Locks Lock Statistics Locks List Log Shipping Log Shipping Error Logical Disks Memory Manager Mirroring Mirroring Performance Counters Missing Indexes Plan Cache Distribution Plan Cache List Replication Agents Replication Agent Session Actions Replication Agent Session Merge Articles Replication Agent Sessions Replication Agent Sessions by Type Replication Available Replication Publications Replication Subscriptions Reporting Services Resource Pool Session Data Session Trace SQL PI Instance Statistics SQL Server Connections Summary SQL Server Global Variables SQL Server Host SQL Server Load SQL Server Services SQL Server Throughput SQL Server Version Info SSIS OS Statistics SSIS Summary Statistics Top SQLs Top SQL Batch Text Top SQL Long Text Top SQL Plan Top SQL Short Text Top SQL Summary Traced SQL PA Usability User-defined Performance Counters User-defined Queries Virtualization XTP Session Transactions Statistics

Reviewing SQL Server Configuration

The SQL Server Configuration panel allows carrying out the following tasks:

Viewing the Server Property Values

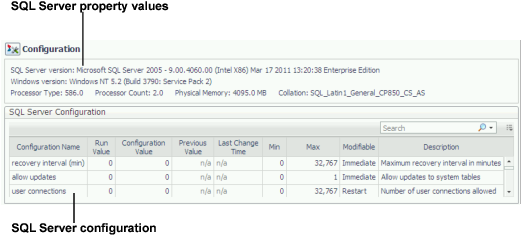
The Server Property Values panel contains information about the server properties of the monitored SQL Server instance.

Version number of the currently monitored SQL Server instance.

The full version number of the Windows operating system installed on the computer that runs the SQL Server instance (including build and service pack).

The processor type (usually a vendor code).

The number of processors on the computer on which Windows is installed.

The amount of actual RAM in the monitored host.

Default collation for databases on the SQL Server instance. Unless another collation is specified when creating a new database, this collation will apply to all of the instance’s databases.

Viewing the SQL Server Configuration Options

The SQL Server Configuration table displays the configuration parameters for the currently monitored SQL Server, as listed in the table below. These parameters often affect the system’s performance. Therefore, reviewing the values displayed in this table and modifying them, if needed, may successfully resolve performance issues.

To create a custom filter for this table, use the options accessible by clicking the button at the table’s upper right side. For details, see Components Shared by all Foglight for SQL Server Screens .

The name of the specified configuration option.

The value currently used by the configuration option.

The value to which the configuration option is set. Depending on the Modifiable setting, changing the Config value can be implemented either immediately or only after restarting SQL Server.

The configuration option’s value before the last change took place.

The time the most recent change took place.

The minimum permitted value for the configuration option.

The maximum permitted value for the configuration option.

Indicates when changes to the option take effect.

The following options are possible:

Immediate: changes to these options take effect immediately.
Restart: changes to these options take effect after SQL Server is stopped and restarted.
Never: these options cannot be modified.

Description of the specified configuration option.

Managing Foglight for SQL Server Agent Settings

You use the Databases Administration dashboard to set options for collecting, storing, and displaying data about monitored SQL Server instances.

Related Documents

The document was helpful.

Select Rating

I easily found the information I needed.

Select Rating