|
1 |
Click the Oracle tile. |
|
2 |
Go to the CRS tab. |
|
3 |
Click Monitor more Clusterwares at the upper left corner above of the Databases table. |
|
4 |
In the Configure CRS Agent screen, use the CRS agent name field to set a user-defined name for the agent. Alternatively, accept the default name provided for the CRS agent. |
|
5 |
|
6 |
Click Next. |
|
7 |
Use the Configure Nodes for Monitoring screen to add the requested CRS nodes, using either of the following methods: |
|
8 |
|
c |
To select existing credentials using the Foglight lockbox mechanism, click Select from stored credentials... |
|
13 |
|
16 |
Click Add nodes. |
|
17 |
Select the option Add manually. |
|
19 |
Click Next. |
|
20 |
Click Finish to return to the Databases dashboard. |
|
IMPORTANT: Unlike Foglight for Oracle instances, the agent properties of CRS agents cannot be modified using the Databases Administration dashboard, but only through the default Foglight tools (see Foglight Administration and Configuration Guide). Clicking Agent settings and selecting the Administration option only allows re-running the wizard used for configuring the instances for monitoring, and changing the options defined using this wizard. |
|
2 |
Click Settings. |
|
3 |
Select Configure CRS agent to re-run the wizard used for configuring the agents for monitoring, and change the options defined using this wizard. |
|
2 |
Go to the Exadata tab. |
|
3 |
Click Monitor at the upper left corner above of the Databases table. |
|
4 |
Click Next. |
|
5 |
Click Add switches. |
|
7 |
Select the option Add manually. |
|
• |
For a single switch, click Set credentials on the switch’s Status row. |
|
• |
|
8 |
|
9 |
Select the option Discover by switch name. |
|
11 |
|
12 |
The following screen, Monitor Exadata Cells, contains a table that lists all of the Exadata Cells that were automatically discovered when the InfiniBand switches were configured for monitoring. If the stage of configuring InfiniBand switches was skipped, this table is empty and cells need to be added manually. |
|
13 |
Click Add cells. |
|
14 |
Click Apply. |
|
15 |
Click Next. |
|
16 |
Click Finish to return to the Databases dashboard. |
|
IMPORTANT: Unlike Foglight for Oracle instances, the agent properties of ASM instances cannot be modified using the Databases Administration dashboard, but only through the default Foglight tools (see Foglight Administration and Configuration Guide). Clicking Agent settings and selecting the Administration option only allows re-running the wizard used for configuring the agents for monitoring, and changing the options defined using this wizard. |
|
2 |
Click Settings. |
|
3 |
Select Configure Exadata agent to re-run the wizard used for configuring the agents for monitoring, and change the options defined using this wizard. |
|
IMPORTANT: Before configuring a new complete Data Guard environment via the Data Guard tab, you should add to monitoring its Primary database and Standby database using the Oracle Instances > Monitor dashboard; otherwise you will not be able to add these databases to the configured Data Guard environment. Creating a new Data Guard environment via the Data Guard tab is an optional feature which provides detailed visibility into your data guard environments performance and stability. For more information about how to add the Primary database and Standby database, refer to Installing and Monitoring a Single Oracle Instance . |
|
1 |
|
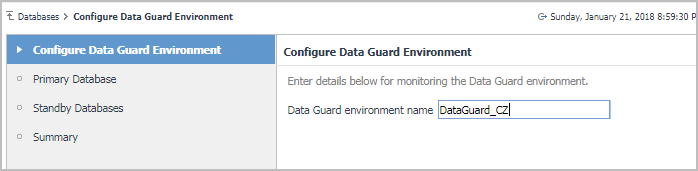
2 |
Configure Data Guard Environment: specify the Data Guard environment name or use a default name, and then click Next. |
|
1 |
|
2 |
Choose a database from the Choose Primary Database drop-down list. |
|
• |
Specify login credentials with sysdba privileges checkbox is not checked: The monitoring of the Primary database will be with already defined db user. |
|
• |
Specify login credentials with sysdba privileges checkbox is checked: The monitoring of the Primary database will be with a new user that has SYSDBA privileges. In this case the SYSDBA credentials will be saved in the agent. |
|
2 |
|
• |
Specify login credentials with sysdba privileges checkbox is not checked: Monitoring the Standby database with already defined db user. You still need to provide an user with SYSDBA privileges for verification. The SYSDBA credentials will not be saved in the agent. |
|
• |
Specify login credentials with sysdba privileges checkbox is checked: Monitoring the Standby database with a new user that has SYSDBA privileges. In this case the SYSDBA credentials will be saved in the agent. |
|
5 |
Summary: find the list of all databases that were configured for a new Data Guard environment. If all details are correct click Finish. |
