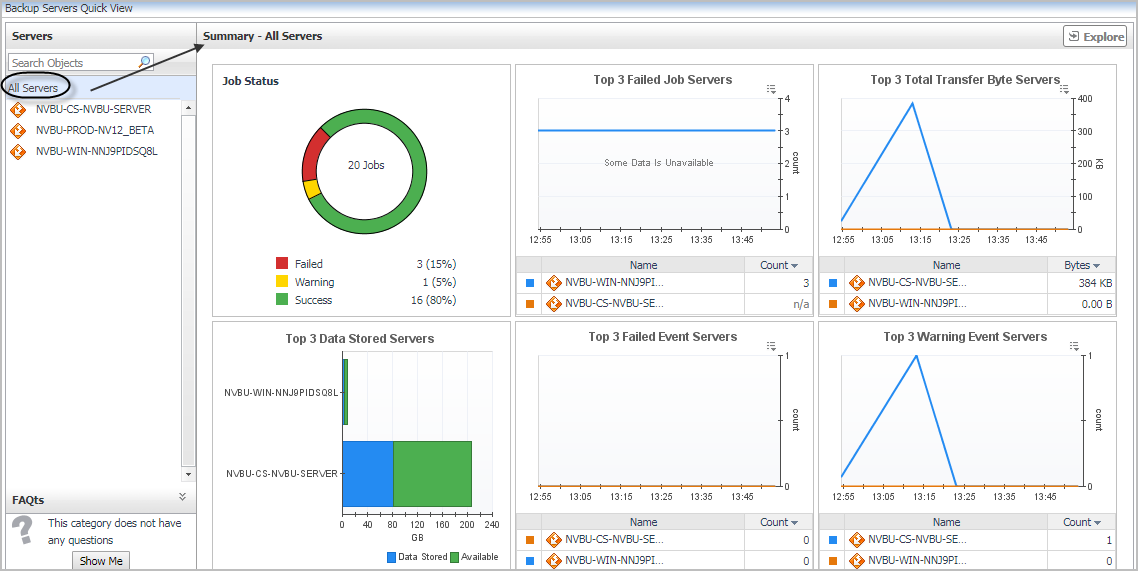
The Summary - All Servers view appears on the right when you select All Servers in the Servers tree view.
The Summary - All Servers view displays the following data:
|
• |
Job Status: Displays the number and status (Failed, Warning, or Success) of Jobs existing in all NetVault Backup Servers available in the monitored environment. |
|
• |
Top 3 Failed Job Servers: Based upon the failed job counts, lists the NetVault Backup Servers in descending order. |
|
• |
Top 3 Total Transfer Bytes: Based upon the value of transfer bytes, lists the top three NetVault Backup Servers. |
|
• |
Top 3 Data Stored: Based upon the value of stored data, lists the NetVault Backup Servers in ascending order. |
|
• |
Top 3 Failed Events: Based upon the number of failed events, lists the top three NetVault Backup Servers. |
|
• |
Top 3 Warning Events: Based upon the number of warning events, lists the top three NetVault Backup Servers |
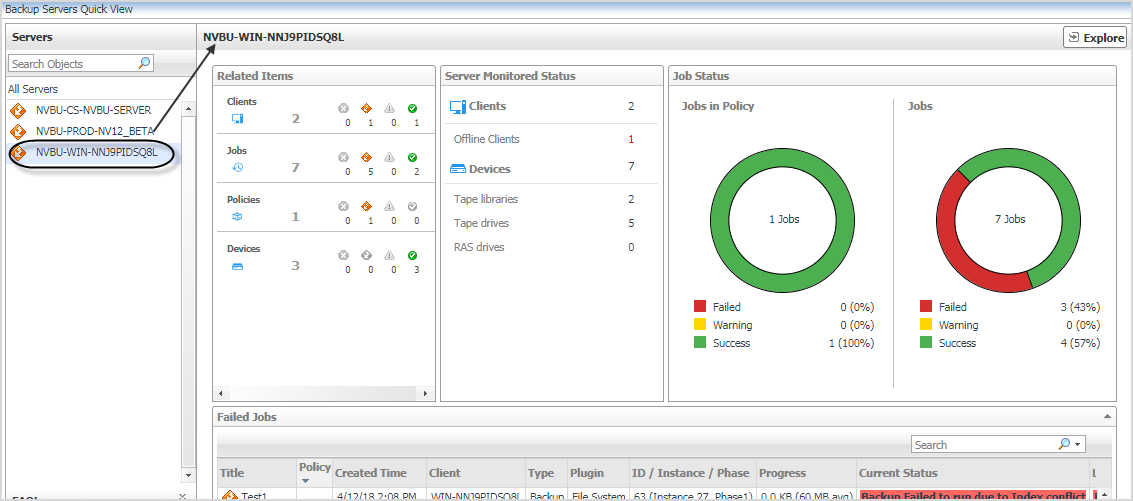
The Individual Server Summary view appears on the right when you select a server in the Servers tree view.
The Individual Server Summary view displays the following data:
|
• |
Related Items: Shows the number of Clients/Jobs/Policies/Devices that are affiliated with this NetVault Backup Server. |
|
• |
Server Monitored Status: Shows the number of total and online Clients/Devices, and the number of Healthy/Warning/Error Jobs. |
|
• |
|
• |
Failed Jobs: Displays the detailed information about all failed jobs happened in this NetVault Backup Server. |
Click Explore on the upper right of the Individual Server Summary view to open the Server Explorer view, which shows more detailed information about this NetVault Backup Server.
The Server Explorer view opens when you click Explore in the Individual Server Summary view, which includes the following tabs:
|
• |
Server Summary tab: This tab shows the same with Individual Server Summary view. |
The Server Performance tab displays the resource utilization for the selected NetVault Server over a selected period of time, which includes the following:
|
• |
CPU: Shows the CPU utilization summary for the selected NetVault Server based on its total capacity during a selected time period. |
|
• |
Memory: Shows the physical memory utilization summary for the selected NetVault Server, broken into the amounts of memory that is swapped to disk, actively used, and allocated, all during a selected time period. |
|
• |
Storage: Shows the disk utilization summary for the selected NetVault Server during a selected time period. |
|
• |
Network: Shows the network utilization summary for the selected NetVault Server, including the average rate of network throughput, and the amounts of data sent to and received from the network. |
|
• |
Alarms: Displays a list of alarms generated against the NetVault Server selected in the Servers tree view. Use this view to quickly identify any potential problems related to a specific NetVault Server. |
If the Host is not in the same domain with the Foglight Agent Manager on which the NetVault agent is running, there will be no data displayed in the Server Performance tab. In this case, do the following:
|
1 |
|
2 |
Add the following line in the hosts file, then save and close. |
|
3 |
|
4 |
Host and Agent Manager: Specify the name or IP address of the host to be monitored, select an Agent Manager and OS type, and then click Next. |
|
5 |
Agent Properties: Specify the following agent properties, and then click Next. |
|
• |
Agent Name: Type the fully qualified host name of the machine on which the monitored the host specified in step 4. |
|
• |
Collect Top N Process Details: Select this option if you want to collect top N server details from the monitored NetVault environment. |
|
• |
Use Ping to validate host availability: Select this option if you want to enable the host availability validation using ping command. |
|
• |
Top CPU Processes: Type a positive integer, for example, 5. This means the agent will collect top five NetVault Servers with the highest CPU utilization. |
|
• |
Top Memory Processes: Type a positive integer, for example, 5. This means the agent will collect top five NetVault Servers with the highest memory utilization. |
|
• |
Top IO Processes: Type a positive integer, for example, 5. This means the agent will collect top five NetVault Servers with the highest data transfer rates. |
|
• |
Collect Process Metrics: Select this option if you want to collect process metrics from the monitored NetVault environment. |
|
• |
Aggregate Program Instances Data: Select this option if you want to aggregate the data of program instances. |
|
• |
|
• |
Excluded Drives: Select a list in which you want to specify the drives that you want to exclude from monitoring. You can select or clone an existing list, and edit it, as required. The default list is defaultExcludedDrives. Lists can be shared between multiple agent instances. |
|
• |
Host Name Expression: The name of one or more hosts that you want to exclude from monitoring. To specify multiple hosts, you must use regular expressions. |
|
• |
Drive Name Expression: The name of one or more drives that you want to exclude from monitoring. To specify multiple drives, you must use regular expressions. |
|
• |
Process Availability Config: Select a list in which you want to configure the process availability. You can select or clone an existing list, and edit it, as required. The default list is defaultProcessAvailabilityConfig. Lists can be shared between multiple agent instances. |
|
• |
Process Name: The name of process that you want to configure its availability. |
|
• |
Command Line: The command line used to validate the process availability. |
|
• |
Expected Process Count: The amount of expected process. |
|
• |
Include mounted remote filesystems: Select this option if you want to include one or more mounted remote FileSystems. |
|
• |
Filesystem Type Config: Select a list in which you want to configure the process availability. You can select or clone an existing list, and edit it, as required. The default list is defaultProcessAvailabilityConfig. Lists can be shared between multiple agent instances. |
|
• |
Process Name: The name of process that you want to configure its availability. |
|
• |
Command Line: The command line used to validate the process availability. |
|
• |
Expected Process Count: The amount of expected process. |
|
• |
Collect Service Metrics: Select either of the following: Collect all services, Do not collect service, Collect only specified services. |
|
• |
Services to Monitor: This option takes effect only when Collect only specified services is selected above. Select a service list that you want to collect. |
|
• |
Collect Log Events: Select this option if you want to collect log events from the monitored NetVault environment. |
|
• |
EventLog Backlog Hours: Type a positive integer, for example, 1. This means the last one-hour log events will be saved. |
|
• |
Event Logs To Monitor: Select a list that includes the log classes to be collected. You can select or clone an existing list, and edit it, as required. The default list is defaultEventLogs. Lists can be shared between multiple agent instances. |
|
• |
Event Log Filter: Select a list of log filters. You can select or clone an existing list, and edit it, as required. The default list is defaultEventFilter. Lists can be shared between multiple agent instances. |
|
• |
Event Log Severity: Select a list of log severity. You can select or clone an existing list, and edit it, as required. The default list is defaultEventSeverityMap. Lists can be shared between multiple agent instances. |
|
• |
Collector Configuration: This option is also knowns as Data Collection Scheduler. The default list is defaultScheduler. |
|
• |
Name: Contains the name of the default collector. |
|
• |
Interval: Contains the length of the default collection interval. |
|
• |
Unit: Contains the time unit for measuring the default collection interval: milliseconds, seconds, minutes, hours, or days. |
|
• |
Fast-Mode Interval: Contains the length of the collection interval when the agent is running in fast mode. |
|
• |
Fast-Mode Unit: Contains the time unit for measuring the collection interval when the agent is running in fast mode: milliseconds, seconds, minutes, hours, or days. |
|
• |
Fast-Mode Max Count: Contains the maximum count of entries when the agent is running in fast mode. |
|
6 |
Credential Verification: select one of the following options: |
|
• |
Do not configure a credential: Select this option if you want to configure the credential for this resource at a later time. |
|
• |
Add host(s) to a new credential: Select this option if you want to add the host to a new credential. This option is suitable if none of the existing credentials have the connection details needed to access the new host. |
|
• |
Add host(s) to an existing credential: Select this option if you want to add the host to an existing credential. This option is suitable if an existing credential has the security data needed to access the new host, but you need to edit its resource mappings to include this host. |
|
7 |
Summary: Review the information provided about the host and the monitoring agent, and click Finish. |
The Server Dependency tab visualizes the relationships between the objects in your environment through an interactive dependency map. The map illustrates how different components relate to each other, and the levels of the available resources available to them. The Server Dependency tab provides a quick and easy way to view components grouped by device.
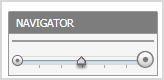
In a large multi-component environment, dependency maps are likely complex and may not fit your screen. The NAVIGATOR in the bottom-right corner allows you to easily set the zoom level by dragging the slider into the appropriate position. In addition,
The Backup Clients Quick View, which appears after clicking Monitoring > Client, shows the data collected about the selected NetVault environment. This view consists of the following two panes:
|
• |
The Clients tree view, which appears on the left of Backup Clients Quick View, lists the NetVault Clients existing in the monitored NetVault environment. |
|
• |
The Summary - All Clients view, which appears on the right after you click the All Clients node in the Clients tree view. |