|
1 |
On the Application Servers Monitor dashboard, click a tile (Systems, Servers, Deployed Applications, Requests, or Methods). |
|
3 |
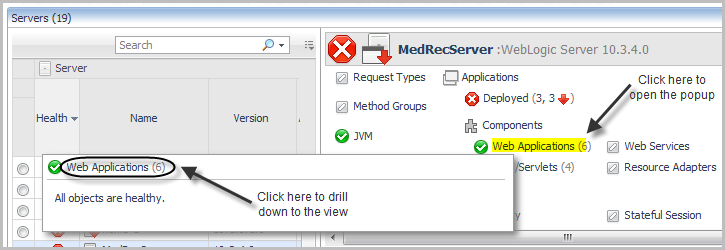
In the upper left corner of the pop-up, click Web Applications to open the drilldown view in the display area. |
Drill down on any JVM link.
|
Heap Used & Committed Chart — plots the heap usage over time. GC Rate & Overhead Chart — plots the garbage collection rate and overhead over time. Threads CPU Usage — plots the amount of CPU resources used by JVM threads over time. |
Use this view to examine the status of Java EE Methods for a selected system or server.
Drill down on any Method Groups link from the Systems or Servers views.
|
Lists the name, health, system, and statistics for a selected method. |
Use this view to examine the status of requests for a selected system or server.
Drill down on any Requests link in the Systems view, or any Request Types link in the Servers view.
|
Lists the name, health, system, and statistics for a selected request. |
