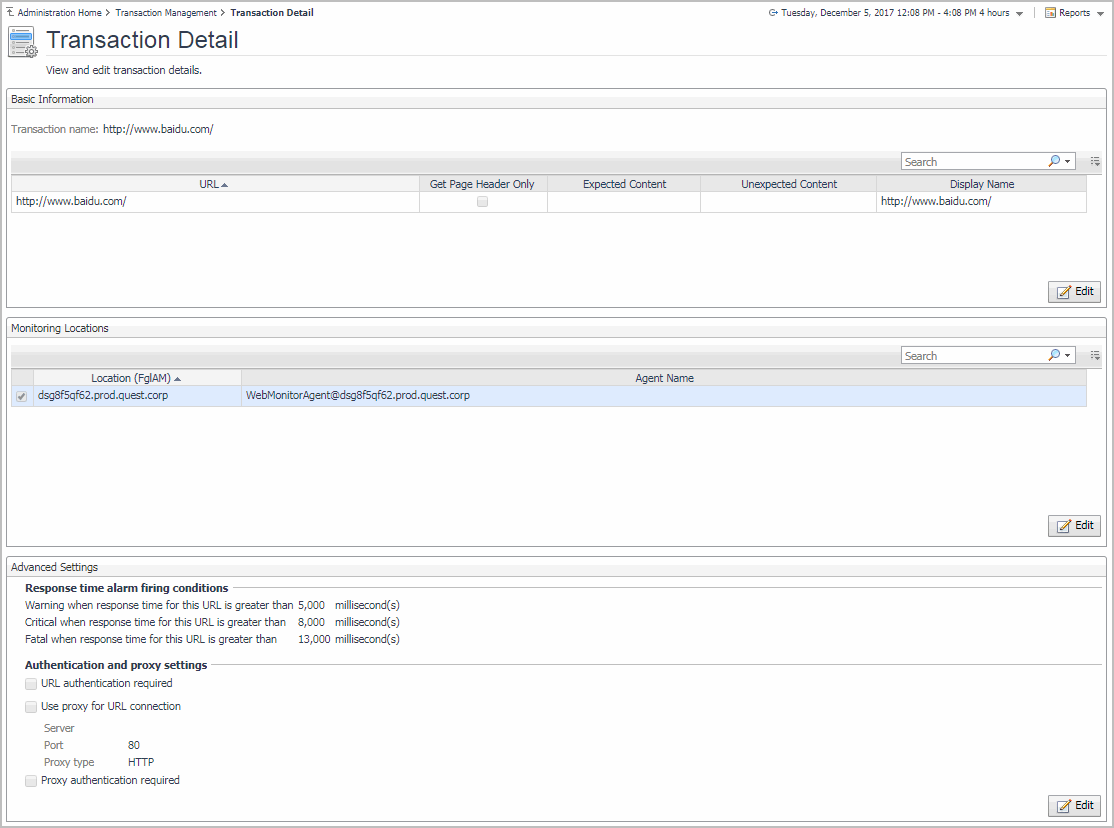
Table 32. Monitoring Locations view
The Transaction Detail view provides details about the selected transaction. Use it to find out the URL of the monitored Web site, the type of monitored content, the locations from which this Web site is monitored, and to review and adjust some advanced settings, if needed.

The Transaction Detail view appears in the display area.
This view is made up of the following embedded views:
|
|
Shows the URL of the monitored Web site. It also indicates whether the agent should retrieve the page header only, and the expected content. |
|
|
|
• |
Expected Content: If content validation is enabled for the agent instance that monitors this URL, and the expected content type is HTML-based, this is indicated in this column. Also, a text string could be used such as “laptop” and type laptop into this column. In case the monitoring agent detects binary content or the text string at this address, the validation fails and the agent logs an error message. If this column is empty, that means the agent is not required to perform content validation. Content validation can be enabled using the URL List secondary agent properties. For more information, see Settings. |
|
• |
Unexpected Content: If unexpected content validation is enabled for the agent instance that monitors this URL, and the unexpected content type is HTML-based, this is indicated in this column. Also, a text string could be used such as “laptop” and type laptop into this column. In case the monitoring agent detects binary content or the text string at this address, the validation fails and the agent logs an error message. If this column is empty, that means the agent is not required to perform unexpected content validation. Unexpected Content validation can be enabled using the URL List secondary agent properties. For more information, see Settings. |
|
• |
URL. The URL of the monitored Web site. | |
Table 33. Advanced Settings view
The Transaction Detail view provides details about the selected transaction. Use it to find out the URL of the monitored Web site, the type of monitored content, the locations from which this Web site is monitored, and to review and adjust some advanced settings, if needed.

The Transaction Detail view appears in the display area.
This view is made up of the following embedded views:
|
|
Shows the URL of the monitored Web site. It also indicates whether the agent should retrieve the page header only, and the expected content. |
|
|
|
• |
Expected Content: If content validation is enabled for the agent instance that monitors this URL, and the expected content type is HTML-based, this is indicated in this column. Also, a text string could be used such as “laptop” and type laptop into this column. In case the monitoring agent detects binary content or the text string at this address, the validation fails and the agent logs an error message. If this column is empty, that means the agent is not required to perform content validation. Content validation can be enabled using the URL List secondary agent properties. For more information, see Settings. |
|
• |
Unexpected Content: If unexpected content validation is enabled for the agent instance that monitors this URL, and the unexpected content type is HTML-based, this is indicated in this column. Also, a text string could be used such as “laptop” and type laptop into this column. In case the monitoring agent detects binary content or the text string at this address, the validation fails and the agent logs an error message. If this column is empty, that means the agent is not required to perform unexpected content validation. Unexpected Content validation can be enabled using the URL List secondary agent properties. For more information, see Settings. |
|
• |
URL. The URL of the monitored Web site. | |
Transaction Management table
The Transaction Management table displays a list of monitored Web sites and helps you understand which locations monitor them. It provides insight into the complexity of your monitored environment.

|
|
|
• |
Active Agents. The number of active Web Monitor Agent instances that currently monitor this Web site out of the total number of agents configured to collect data from it. For example, 1/2 means that only one active agent currently monitors this transaction out of two configured agents. |
|
• |
Locations. The names of the hosts running the Web Monitor Agent instances that currently monitor this Web site. |
|
• |
URL. The URL of the monitored Web site. | |
|
|
Drill down on:
|
Table 34. Transaction Management table
The Transaction Management table displays a list of monitored Web sites and helps you understand which locations monitor them. It provides insight into the complexity of your monitored environment.

|
|
|
• |
Active Agents. The number of active Web Monitor Agent instances that currently monitor this Web site out of the total number of agents configured to collect data from it. For example, 1/2 means that only one active agent currently monitors this transaction out of two configured agents. |
|
• |
Locations. The names of the hosts running the Web Monitor Agent instances that currently monitor this Web site. |
|
• |
URL. The URL of the monitored Web site. | |
|
|
Drill down on:
|