How to Get Here
To open the Instance home page, from the Databases dashboard, find the instance you want to explore and click the instance name (or click  and select Overview). The Databases > Overview dashboard opens with a summary of the selected instance.
From here, you can drill down to metrics on memory allocation and perform configuration tasks.
The following summary and drill-downs pages are provided:
Summary
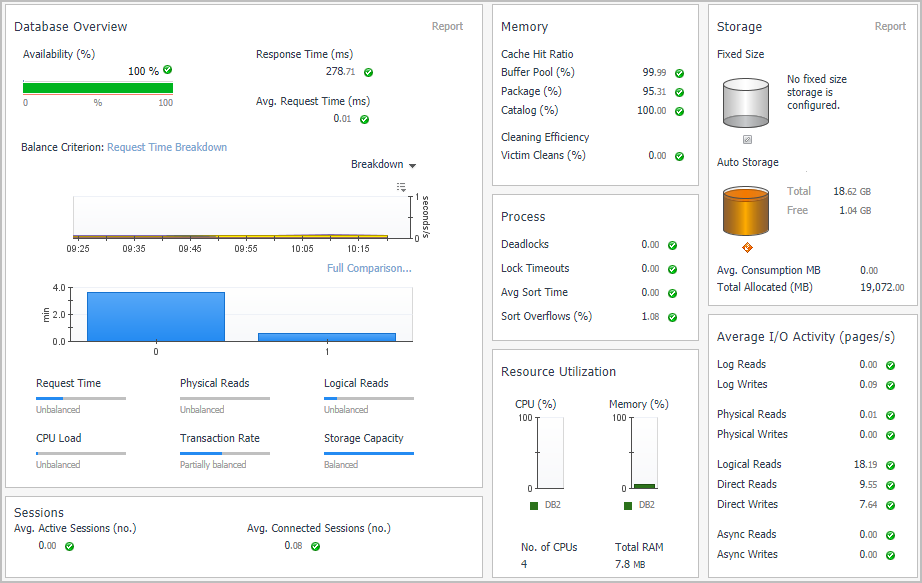
By default, the Summary page view is displayed on the Instance home page. The Summary page contains the following embedded panes:
The Status pane displays metrics that provide an overview of the current state of the DB2 instance. It is at the top of the Instance home page.
|
|
|
• |
Sessions (no.). The total number of active and inactive sessions within the instance. | |
|
|
|
• |
CPU (%). Total is the average CPU usage of all the underlying hosts on which the instance resides. DB2 is the total CPU usage by all DB2 processes running on the host. | |
|
|
|
• |
Memory (%). Total is the average memory usage of all the underlying hosts on which the instance resides. DB2 is the total memory usage by all DB2 processes running on the host. | |
|
|
|
• |
Instance Information. The configuration information for the instance (including the product version and whether the product is licensed). Click the icon for the configuration information. | |
|
|
|
• |
Active Databases. The total number of local databases within the instance that have applications connected. | |
|
|
|
|
|
|
• |
Up since. The date and time the instance was started. | |
|
|
|
• |
Status. Whether the instance is active. | |
|
|
|
|
|
|
• |
pureScale only — Active Members. Number of nodes in the pureScale environment. | |
|
|
|
• |
pureScale only — Active CF. Displays information about configured CF nodes and their states. | |
|
|
|
• |
pureScale only — pureScale Alerts. Total number of alerts DB2 reported on the pureScale environment. | |
|
|
|
The Storage pane provides current storage information for the entire instance. It is at the left of the Instance home page.
The Agents pane provides registered and stolen agents information for the entire instance. It is located in the middle of the Instance home page.
The FCM pane displays FCM metrics for a partitioned instance. It is at the left and in the middle of the Instance home page.
When an instance is hosted in a DB2 pureScale environment, you can click the pureScale CF link to see metrics about the cluster cache facility (CF).
The Reports pane provides access to the Executive Workload Summary Report, which is a workload overview of the instance and of each database. It is at the bottom left of the Instance home page.
Click the Executive Summary Report link to access the report.
The History pane displays the instance activity over the course of the selected time range. It is at the upper right of the Instance home page.
|
|
|
• |
Top Database Workload. The top three (if available) database workloads, over the course of the selected time range. | |
|
|
|
• |
Top Database Request Time. The top three (if available) database total request times and wait request times, over the course of the selected time range. | |
|
|
|
The Alarms pane displays the total number of fatal, critical, and warning alarms that are currently outstanding against the instance. It is at the lower right of the Instance home page.
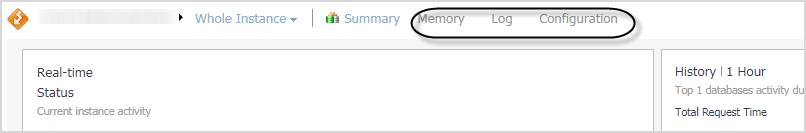
Memory Drill-down
The Memory view provides metrics on how the databases in the instance use memory.
On the Instance home page, click Memory.
This home page contains the following embedded views:
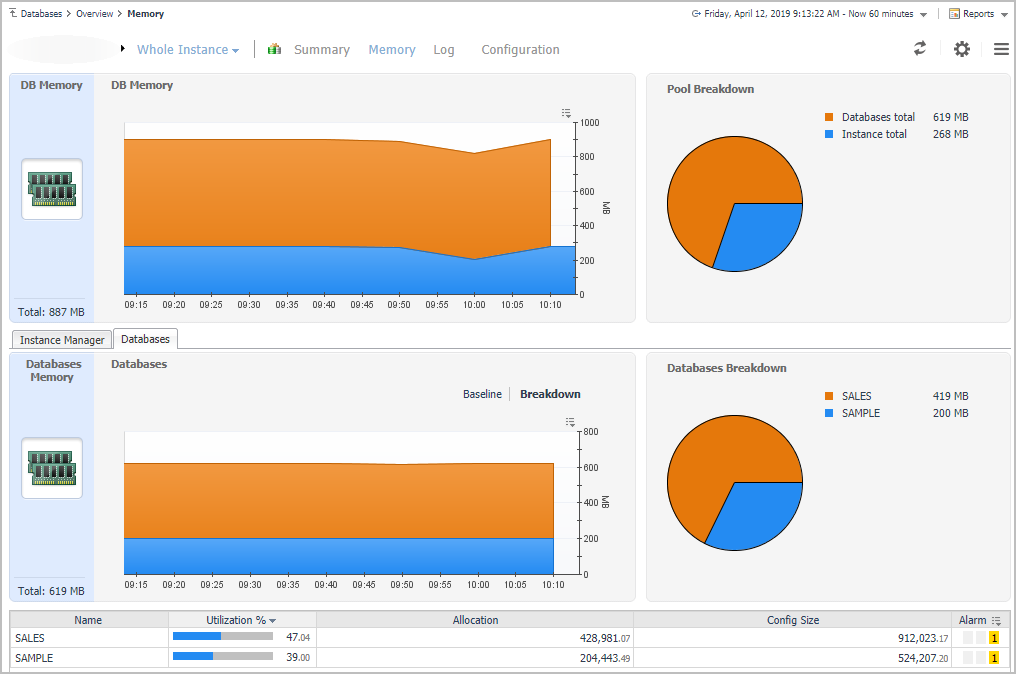
Shows how the total memory available for the instance is allocated to the database and CF pools.
|
|
|
• |
DB Memory. Displays the total memory allocated to the selected instance and its databases in a stacking area chart. For pureScale environments, also shows primary and backup CF allocations. | |
|
|
|
• |
Pool Breakdown. Displays the total memory allocated to the selected instance and its databases as a pie chart. For pureScale environments, also shows primary and backup CF allocations. | |
Shows where the instance gets its memory.
|
|
|
|
|
|
• |
Pool Allocated Size. Displays the pools that contribute to the memory for the instance as a stacking area chart. | |
|
|
|
|
|
|
|
• |
Utilization %. The percentage of configured allocated memory that is in use. | |
|
|
|
• |
Allocation. The average allocated size (in KB) of a memory pool. | |
|
|
|
• |
Config Size. The internally configured size (in KB) of a memory pool in the DB2 database system. | |
|
|
|
• |
Alarm. The alarm count and state of the memory pool. Click an alarm count to view information about the alarm on the Outstanding Alarms dialog box. For complete information about alarms in Foglight, see the Foglight User Help. | |
Shows memory utilization by database.
|
|
|
• |
Databases Memory. Displays the total memory allocated to the databases in the instance as a stacking area chart. | |
|
|
|
• |
Databases Breakdown. Displays the total memory allocated to the databases in the instance as a pie chart. | |
|
|
|
• |
Name. The name of the databases in the selected instance. | |
|
• |
Utilization %. The percentage of configured allocated memory that is in use. | |
|
|
|
• |
Allocation. The average allocated size (in KB) of memory allocated to the database. | |
|
|
|
• |
Config Size. The internally configured size (in KB) of memory allocated to the database. | |
|
|
|
• |
Alarm. The alarm count and state of the database. Click an alarm count to view information about the alarm on the Outstanding Alarms dialog box. For complete information about alarms in Foglight, see the Foglight User Help. | |
Displayed for pureScale environments only. Shows how the CF memory is allocated.
|
|
|
• |
Primary CF Memory. Displays the total cluster cache facility (CF) memory available to the instance and a breakdown of how the cache is allocated for locks, GBP, SCA, and other. | |
|
|
|
|
|
|
• |
Pool Name. The name of the buffer pools in the CF component. | |
|
• |
Utilization %. The percentage of configured allocated memory that is in use. | |
|
|
|
• |
Allocation. The average allocated size (in KB) of a buffer pool. | |
|
|
|
• |
Config Size. The internally configured size (in KB) of a buffer pool in the DB2 database system. | |
|
|
|
• |
Alarm. The alarm count and state of the buffer pool. Click an alarm count to view information about the alarm on the Outstanding Alarms dialog box. For complete information about alarms in Foglight, see the Foglight User Help. | |
Displayed for pureScale environments only. Contains the same information as the Primary CF tab, but the monitoring data represents the backup cluster cache facility.
Database home page
The DB2 Database home page provides information on the status of the entire DB2 database, over the course of the selected time range.