Instance home page — Memory Drill-down
The Memory view provides metrics on how the databases in the instance use memory.

On the Instance home page, click Memory.
This home page contains the following embedded views:
Shows how the total memory available for the instance is allocated to the database and CF pools.
|
|
|
• |
DB Memory. Displays the total memory allocated to the selected instance and its databases in a stacking area chart. For pureScale environments, also shows primary and backup CF allocations. | |
|
|
|
• |
Pool Breakdown. Displays the total memory allocated to the selected instance and its databases as a pie chart. For pureScale environments, also shows primary and backup CF allocations. | |
Shows where the instance gets its memory.
|
|
|
|
|
|
• |
Pool Allocated Size. Displays the pools that contribute to the memory for the instance as a stacking area chart. | |
|
|
|
|
|
|
|
• |
Utilization %. The percentage of configured allocated memory that is in use. | |
|
|
|
• |
Allocation. The average allocated size (in KB) of a memory pool. | |
|
|
|
• |
Config Size. The internally configured size (in KB) of a memory pool in the DB2 database system. | |
|
|
|
• |
Alarm. The alarm count and state of the memory pool. Click an alarm count to view information about the alarm on the Outstanding Alarms dialog box. For complete information about alarms in Foglight, see the Foglight User Help. | |
Shows memory utilization by database.
|
|
|
• |
Databases Memory. Displays the total memory allocated to the databases in the instance as a stacking area chart. | |
|
|
|
• |
Databases Breakdown. Displays the total memory allocated to the databases in the instance as a pie chart. | |
|
|
|
• |
Name. The name of the databases in the selected instance. | |
|
• |
Utilization %. The percentage of configured allocated memory that is in use. | |
|
|
|
• |
Allocation. The average allocated size (in KB) of memory allocated to the database. | |
|
|
|
• |
Config Size. The internally configured size (in KB) of memory allocated to the database. | |
|
|
|
• |
Alarm. The alarm count and state of the database. Click an alarm count to view information about the alarm on the Outstanding Alarms dialog box. For complete information about alarms in Foglight, see the Foglight User Help. | |
Displayed for pureScale environments only. Shows how the CF memory is allocated.
|
|
|
• |
Primary CF Memory. Displays the total cluster cache facility (CF) memory available to the instance and a breakdown of how the cache is allocated for locks, GBP, SCA, and other. | |
|
|
|
|
|
|
• |
Pool Name. The name of the buffer pools in the CF component. | |
|
• |
Utilization %. The percentage of configured allocated memory that is in use. | |
|
|
|
• |
Allocation. The average allocated size (in KB) of a buffer pool. | |
|
|
|
• |
Config Size. The internally configured size (in KB) of a buffer pool in the DB2 database system. | |
|
|
|
• |
Alarm. The alarm count and state of the buffer pool. Click an alarm count to view information about the alarm on the Outstanding Alarms dialog box. For complete information about alarms in Foglight, see the Foglight User Help. | |
Displayed for pureScale environments only. Contains the same information as the Primary CF tab, but the monitoring data represents the backup cluster cache facility.
Database home page
The DB2 Database home page provides information on the status of the entire DB2 database, over the course of the selected time range.
How to Get Here
To open the Database home page, from the Databases dashboard, find the database you want to explore and click the instance name (or click  and select Overview). The Databases > Overview dashboard opens with a summary of the selected database.
From the Database home page, you can drill down to other pages that display more detailed metrics about the database.

The following summary and drill-downs pages are provided:
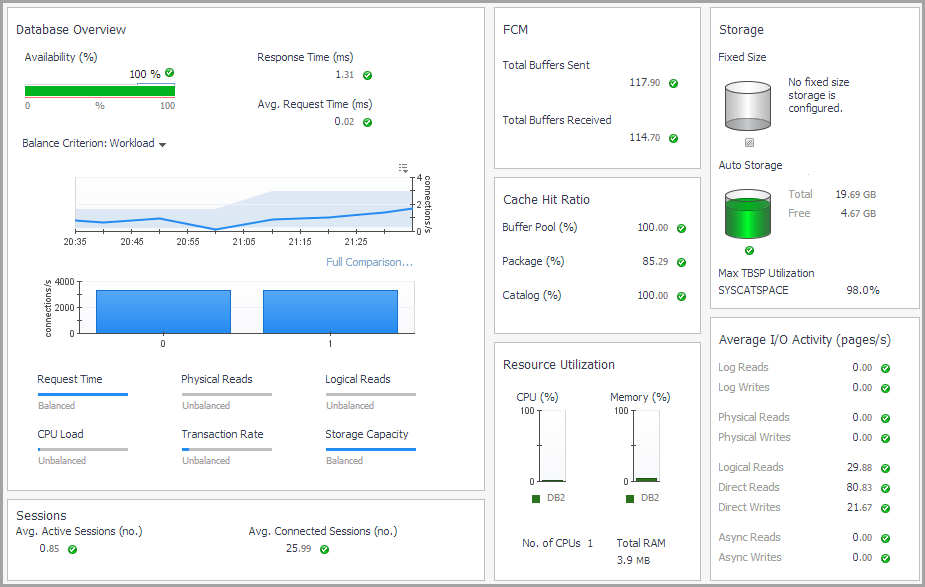
Summary
By default, the Summary view is displayed on the Database home page. The Summary contains the following panes:
The Database Overview pane displays metrics that provide an overview of the status of the entire database, over the course of the selected time range. For a partitioned database, this pane also provides a way to examine the balance of certain individual metrics across the members. The pane is at the left of the Database home page.
|
|
|
|
|
|
• |
Response Time (ms). The average response time of a query when the connection is already open, over the course of the selected time range. | |
|
|
|
• |
Avg. Request Time (ms). The average duration for a single database request, over the course of the selected time range. This metric is only available for DB2 v9.7.0.1 and later. | |
|
|
|
• |
Balance Criterion. The level of balance exhibited, for a particular database criterion (for example, workload in terms of the number of connections), over the course of the selected time range. Click the arrow at the right of “Balance Criterion” to choose a different criterion from the list. | |
|
|
|
• |
Workload. The balance of average active agents across the database members. If most of the activity is on one member, for example, the activity is not balanced. If most of the activity is spread equally across the members, it is balanced. | |
|
|
|
• |
Request Time. The balance of requests across the monitored members, or the extent to which the total request time is spread across the members. This metric is only available for DB2 v9.7.0.1 and later. | |
|
|
|
• |
Physical Reads. The balance of the physical reads across the monitored members, or the extent to which the physical reads operations are balanced across the members. | |
|
|
|
• |
Logical Reads. The balance of the logical reads across the monitored members, or the extent to which the logical reads operations are balanced across the members. | |
|
|
|
• |
CPU Load. The balance of CPU used across the monitored members. | |
|
|
|
• |
Transaction Rate. The balance of the transactions across the monitored members. For example, if most of the transactions are done on one member, the transactions are not balanced. If they are spread equally across the members, they are balanced. | |
|
|
|
|
|
Clicking the icon next to the Availability, Response Time, or Avg. Request Time metric displays a pop-up that provides additional, related information.
Mousing over a data point on either of the Balance Criterion charts displays a pop-up that provides more detailed information about that data point.
Clicking any of the Request Time, Physical Reads, Logical Reads, CPU Load, Transaction Rate, or Storage Capacity charts displays a pop-up that provides additional, related information. |
The Sessions pane displays client application session metrics for the entire database. It is at the lower left of the Database home page.
The FCM pane displays FCM metrics for the entire database. It is located in the upper middle of the Database home page.
The Cache Hit Ratio pane displays cache hit ratio metrics for the entire database. It is located toward the center of the Database home page.
|
|
|
• |
Buffer Pool (%). The percentage of database page I/O requests satisfied using the buffer cache (and therefore the database did not have to perform disk reads), over the course of the selected time range. | |
|
|
|
• |
Package (%). The number of times that a requested section was not available for use and had to be loaded into the package cache. Calculated as a percentage of the total number of times that a section was requested, over the course of the selected time range. | |
|
|
|
• |
Catalog (%). The number of times that a table descriptor or authorization information was not found in the catalog cache and had to be inserted ther. Calculated as a percentage of the total number of times that a table descriptor or authorization information was requested, over the course of the selected time range. | |
|
|
|
• |
pureScale only — Overall BP (%). A percentage that reflects the number of times a requested page was found in the buffer pool out of all times it was requested. If a page is found in the buffer pool, it saves the database the time to look for it in the physical storage. | |
|
|
|
• |
pureScale only — Global BP (%). A percentage that reflects the number of times a requested page was found in the GBP out of all times it was requested. If a page is found in the GBP, it saves the database the time to look for it in the LBP. | |
|
|
|
• |
pureScale only — GBP Full (%). A percentage that reflects the number of times a Group Buffer Pool Full condition occurred per 10,000 commits . | |
|
|
|
The Resource Utilization pane provides information on CPU and RAM consumption for the entire database. It is located in the lower middle of the Database home page.
The Storage pane provides information about fixed and auto storage for the entire database. It is at the upper right of the Database home page.
|
|
|
• |
Fixed Size (MB). The total disk space that is available for use by fixed-size tablespaces and the disk space that is still free to be used by fixed-size tablespaces. | |
|
|
|
• |
Auto Storage (MB). The total file system space that is available for the database to use to carry out auto storage tablespace operations, and the file system space that is still free for the database to use to carry out auto storage tablespace operations. | |
|
|
|
• |
Clicking the Investigate using the “Tablespaces” drilldown link at the bottom of either pop-up takes you to the Tablespaces dashboard for additional information. | |
The Average I/O Activity pane provides I/O metrics for the entire database. It is at the lower right of the Database home page.
