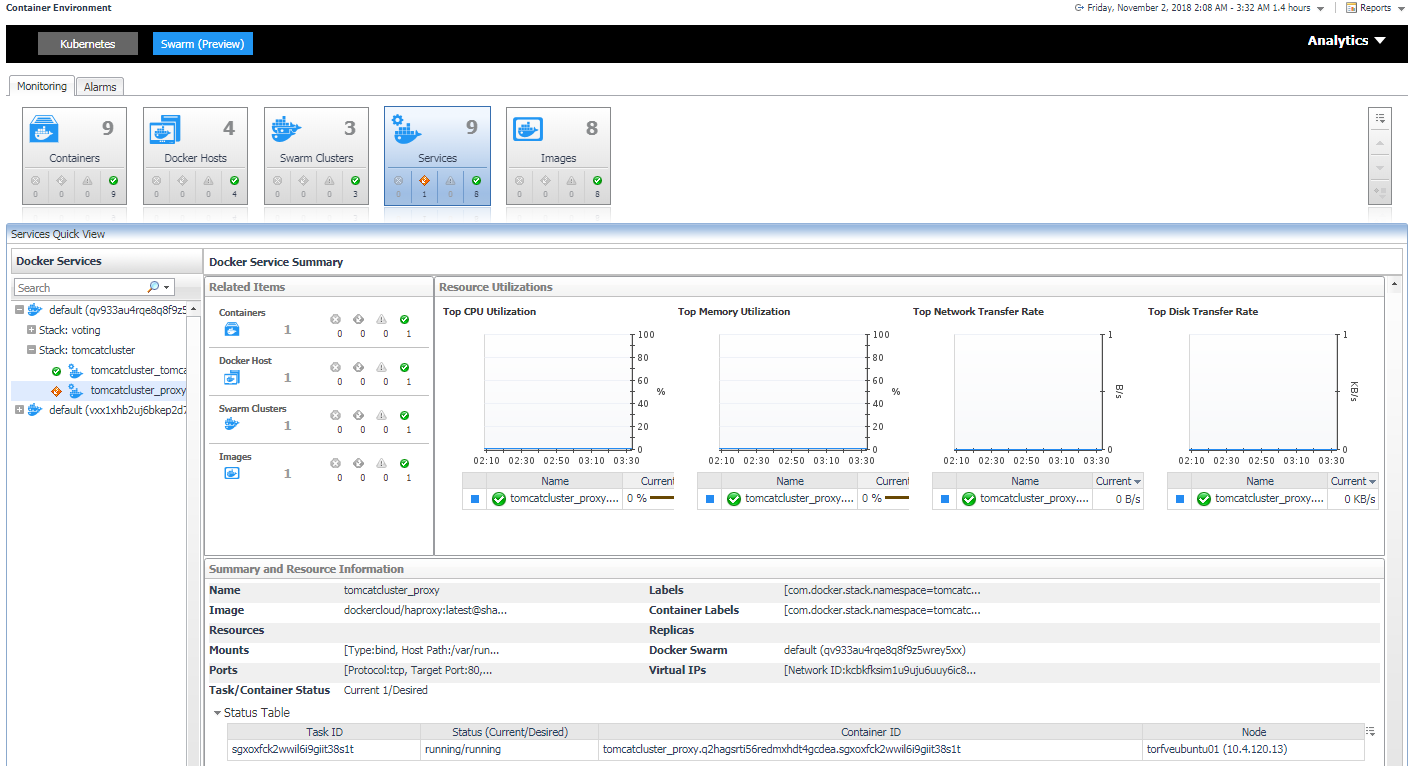
The Docker Swarm Service Summary view appears on the right when you select a docker swarm service in the Swarm Services tree view.
The Docker Swarm Service Summary view displays the following data:
|
• |
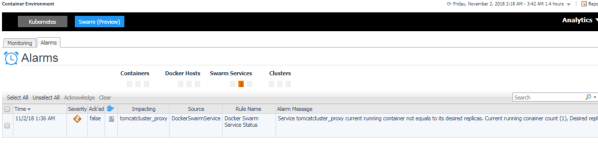
The Alarms dashboard displays a list of alarms generated against the monitored Docker environment. Use this view to quickly identify any potential problems related to a specific Docker component.
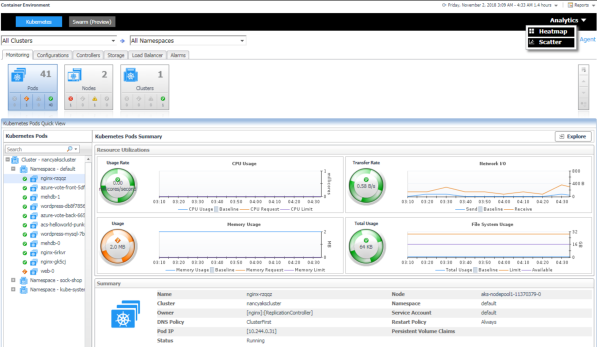
Foglight for Container Management provide analytics feature for Kubernetes and Docker Swarm.
In the Container dashboard, choose Kubernetes from the header. Then click Analytics from the header, a drop down view will display with Heatmap and Scatter on it. Click Heatmap will navigate to the Kubernetes Heatmap Analytics dashboard, while click Scatter will navigate to the Kubernetes Scatter Plot Analytics dashboard.