Foglight for Apache enables you to quickly determine the status of each of your monitored Apache web servers by providing a visual overview of key access and traffic metrics. The Apache Web Server, also known as the Apache Httpd Server, is an open-source project hosted by the Apache Foundation. Through its server status (mod_status) and server information (mod_info) pages, the Apache web server provides a wealth of performance statistics, which Foglight for Apache displays in easy to use dashboards.
|
NOTE: In order for the Apache agent to monitor your web server, the server must have mod_info and mod_status enabled. For more information, see Configuring Apache web servers for monitoring . |
|
• |
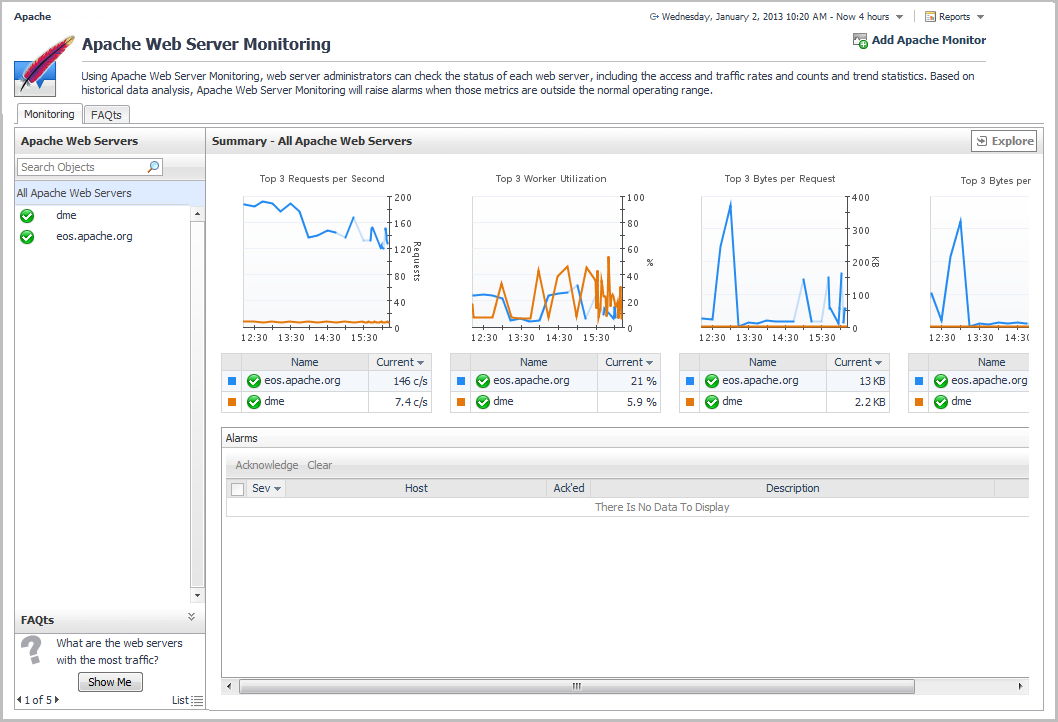
The Summary — All Apache Web Servers view provides charts and lists that identify the top three web servers for four key metrics (from left to right):
|
4 |
|
5 |
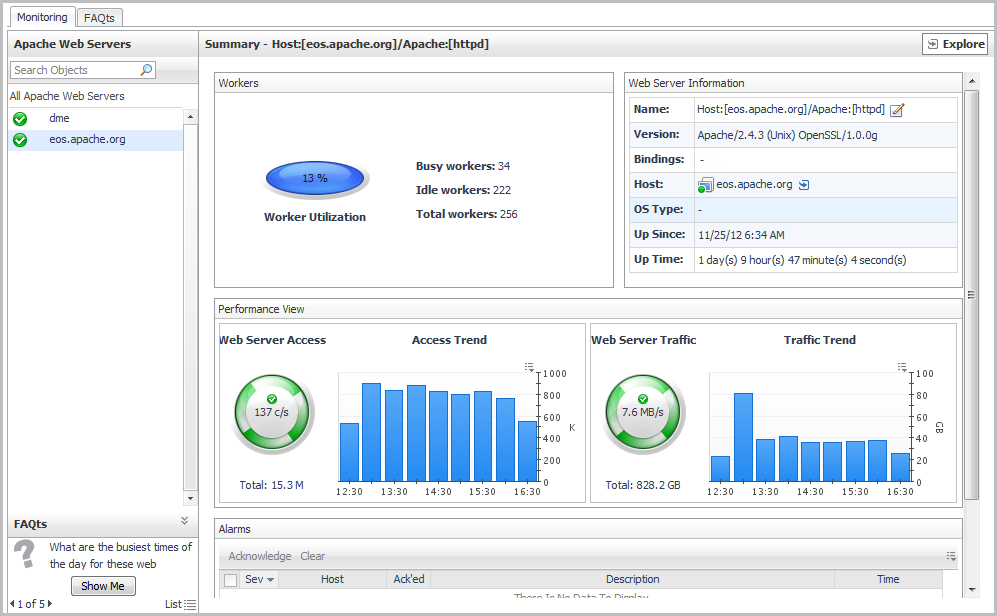
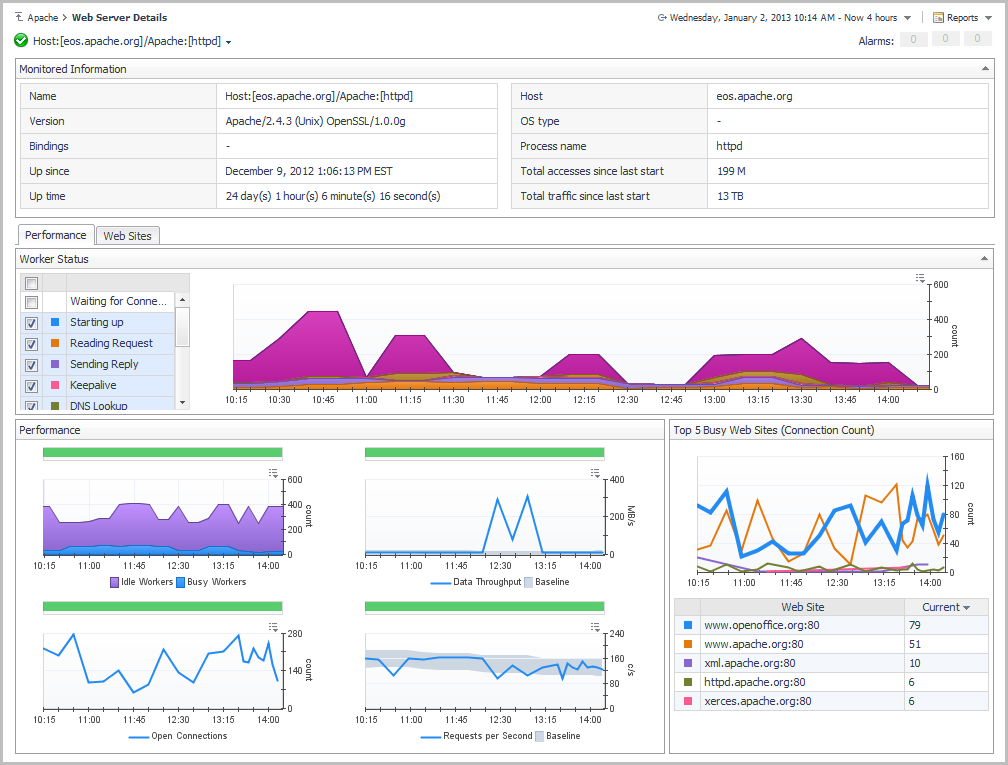
On the Performance tab: |
|
a |
Examine the workers status breakdown. Use the check boxes to the left of the chart to select the worker states to compare over time. By default, all states except Waiting for connections and Open slot with no current process are included. |
|
6 |
Click the Web Sites tab. |
|
1 |
On the navigation panel, click Administration. |
|
2 |
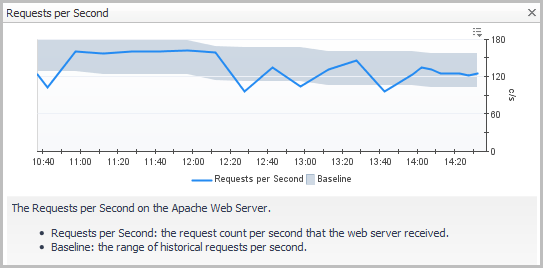
For more information about IntelliProfile baselines and thresholds, see Explore the IntelliProfile dashboard in the Foglight Administration and Configuration Help.
For more information about managing rules in Foglight for Apache, see Configuring Rules and Metric Calculations to Discover Bottlenecks in the Foglight Administration and Configuration Help.
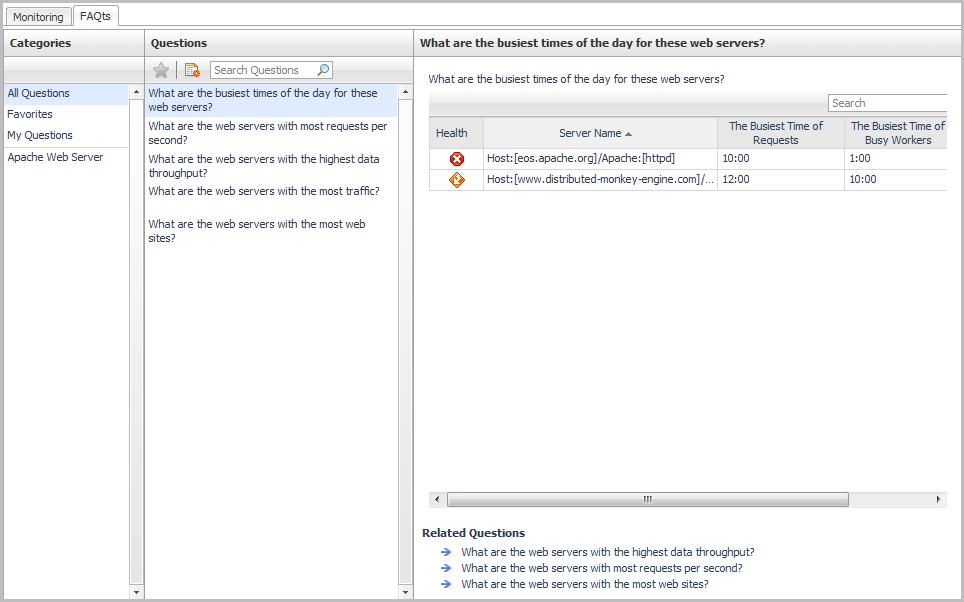
You can access instant answers to questions relating to your web servers, such as during which time periods peak traffic occurs, or which web servers have the most traffic. These frequently asked questions appear on the FAQts tab, or alternatively in the FAQts mini-viewer, located in the bottom-left corner of the Apache Web Server Monitoring dashboard.

|
b |
|
TIP: For some of the questions, you can specify the number of results you want returned (for example, Top # Apache web servers with the highest requests per second). |