Chat now with support
Chat with Support

Foglight for Apache 5.7.0 - User Guide

Monitoring Apache Web Servers

On the navigation panel, under Dashboards, click Apache.
The Summary – All Apache Web Servers view provides charts and lists that identify the top three web servers for four key metrics (from left to right):

Investigating Worker Utilization

The Summary – WebServerName view appears.
4
On the Summary – WebServerName view, click Explore.
The Web Server Details view opens.
5
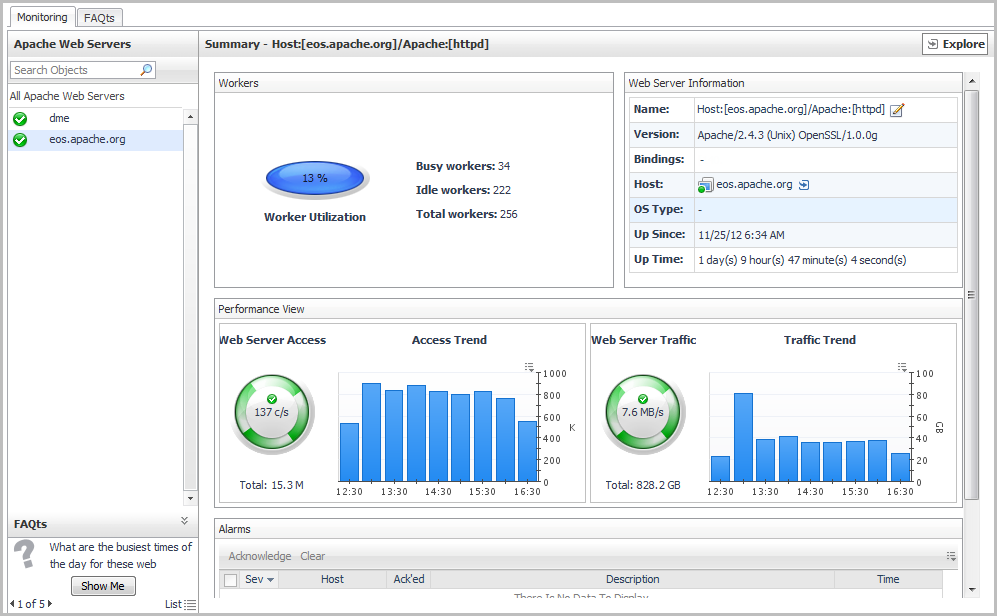
On the Performance tab:
6
Click the Web Sites tab.

Monitoring Web Server Status with Rules and Alarms

2
On the Administration dashboard, under Rules and Notifications, click Rules.

Finding Quick Answers with FAQts

In the mini-viewer, click Show Me. A popup opens, displaying the answer and allowing you to drill down for deeper or related information.
On the FAQts tab, click a question in the Questions column. The answer appears to the right.
TIP: Some of the questions allow you to specify the number of results you want returned (for example, Top # Apache web servers with the highest requests per second).
Figure 5. FAQts Tab
Self Service Tools
Knowledge Base
Notifications & Alerts
Product Support
Software Downloads
Technical Documentation
User Forums
Video Tutorials
RSS Feed
Contact Us
Licensing Assistance
Technical Support
View All
Related Documents

The document was helpful.

Select Rating

I easily found the information I needed.

Select Rating