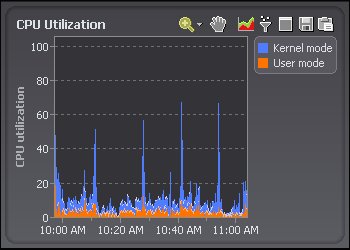
A chart is a component on a Spotlight page that shows data as a graphical image.
Notes:
| Click | Description |
|---|---|
 |
Zoom in on Charts |
 |
Pan Over Zoomed Charts |
 |
Set the Chart View |
 |
Filter on the Data Series |
  |
Maximize and Restore Charts |
 |
Save To File |
 |
Copy To Clipboard |
 |
The legend lists all the data series associated with the chart. Click an item in the legend to highlight its series in the chart. (Click a second time to return the series to its normal appearance.) Move the mouse pointer over an item in the legend to view the current value for that series within the chart. Note: Arrows at the top and bottom of a legend (if displayed) indicate that there are more items in the legend list. Click an arrow to scroll through the list. |
| Right click the table body and select What's This? | View help specific to the chart. |
| Right click the table body and select Restore Default Settings | Restore Default Settings |
| Right click the table body and select View as Grid. | View the data in a Spotlight grid. About Spotlight Grids |
| Right click the table body and select Properties. |
Adjust the chart properties: |
 |
If the diagnostic server is unable to collect the data required, Spotlight displays a small icon on the affected component. Click the icon to see more information about the problem. |
  |
Pause / Resume / Refresh |
