|
1 |
On the navigation panel, under Dashboards, click Application Performance Monitoring > Geographical Perspective. |
|
2 |
The Geographical Perspective for <TransactionName> dashboard opens in the display area. |
|
3 |
|
4 |
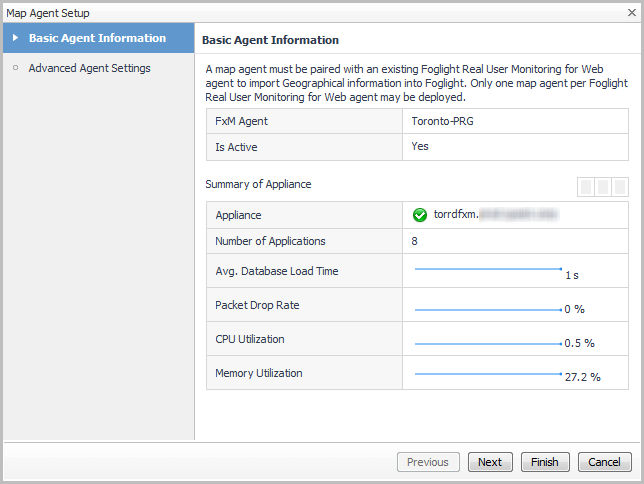
On the Geographical Perspective dashboard, click Create a map agent to import geographic data. |
|
7 |
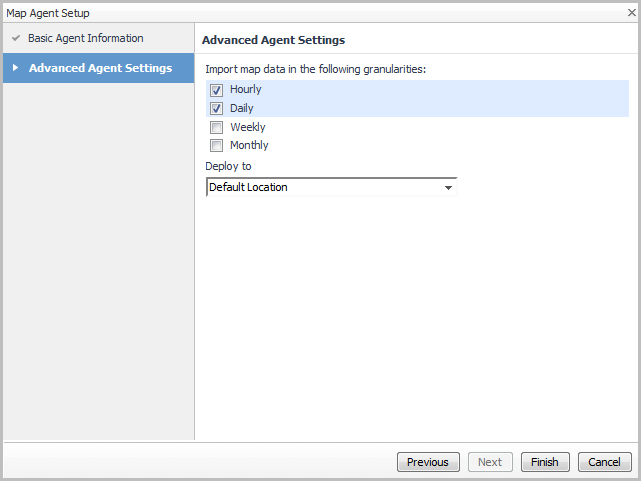
Click Finish. |
|
8 |
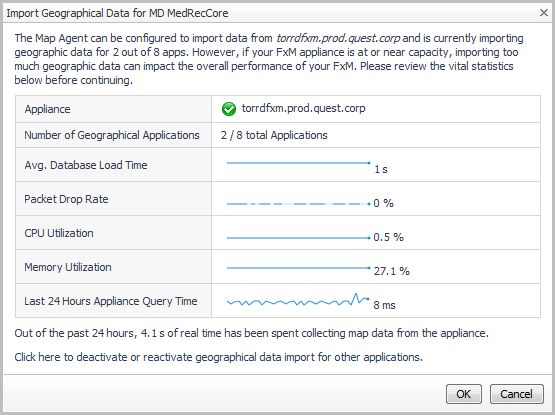
On the Geographical Perspectives for <TransactionName> dashboard, click Import geographical data to import the data for that application from FxM to Foglight. |
|
NOTE: If the load on your FxM Appliance is too high due to other geographic data collections that are currently running, you can deactivate those collections to reduce the load. Click the text link: Click here to deactivate or reactivate geographical data import for other applications. |
|
10 |
Click OK. The map agent imports the geographical data for the selected application. |
If necessary, you can edit the map agent properties through the Agent Status dashboard. For more information, see Editing Map Agent properties.
After you have created a map agent, as described in Creating a map agent for FxM appliance data, you can edit its properties from the Agent Status dashboard. For example, you may want to change the available aggregation granularity, or change the scheduled collection interval.
|
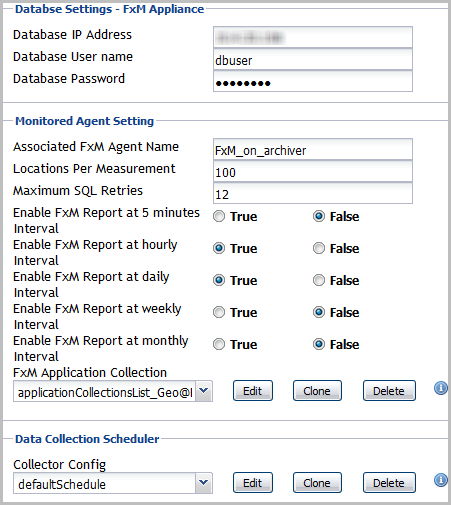
1 |
On the navigation panel, under Dashboards, click Administration > Agents > Agent Status. |
|
2 |
Select the map agent in the list and click Edit Properties. |
|
3 |
Click Modify the private properties for this agent. |
|
5 |
The Associated FxM Agent Name must match the name of the FxM agent exactly. If this box is blank, or if the value does not match that of the FxM agent, the map agent cannot access the FxM data to populate the geographical perspectives. |
|
6 |
The Locations Per Measurement setting determines the number of locations from which real end user activity is collected for display on the Geographical Perspective dashboard. By default, this value is 100. |
|
7 |
The Maximum SQL Retries setting controls the number of times the map agent tries to reconnect to an appliance that is unreachable before stopping data collection. The default is twelve attempts. |
|
8 |
The five True/False settings allow you to specify the granularity of the data aggregation. Click True for each of the FxM reporting intervals you want to make available: five minutes, hourly, daily, weekly, or monthly. By default, the five minute, weekly, and monthly intervals are disabled (set to False). |
|
9 |
The FxM Application Collection list controls which of the available application components the map agent collects data from. |
|
• |
To edit the default list, click Edit. Select or clear the check boxes for the applications and click Save Changes. |
|
10 |
The Data Collection Scheduler setting controls how frequently the map agent checks the FxM Appliance for data. By default, the collection interval is fifteen minutes. |
For more information, see Configuring Response Time Breakdown settings.
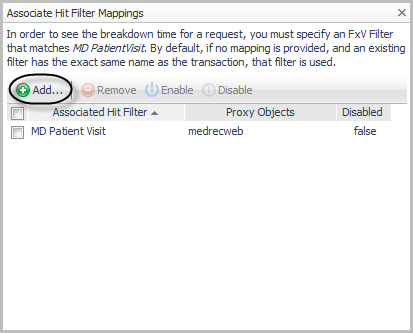
In order to present a comprehensive view of requests as they relate to end user results, you must create a link from the FxV hit filter to the Java™ request and to the FxM (end user) application result.
The response time breakdown only applies to the specific requests that pass through an instrumented application server. The Front End/Back End time breakdown shown on the Real User (FxM) tile applies to complex multi-hit page objects that match the FxM filter. If there is a substantial difference in displayed response time between the Real User Tile and the response time breakdown, the difference is attributable to non-Java page elements.
|
1 |
On the SOC, click the title bar of the Real User (FxM) tile of the application result you want to work with. |
|
2 |
Click the Response Time Breakdown tab. |
|
3 |
Click Associate Hit Filter Mappings. |
|
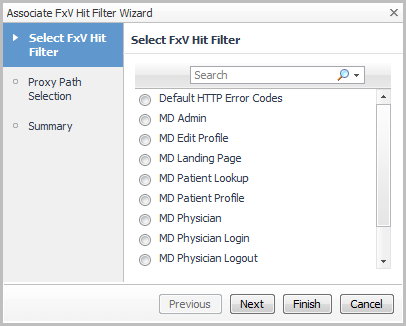
4 |
Click Add. |
|
6 |
Optional — click Next to configure proxy objects. For more information about assigning proxy objects, see Assigning proxy objects. |
|
7 |
Click Finish. |
