
|
The CPU Load spinner indicates the current percentage of the selected virtual machine’s CPU load, used to execute system code and user programs, based on the total CPU capacity.
The % Used line in the CPU Utilization chart shows the percentage of the CPU utilization used by the virtual machine to execute system code and user programs, during the selected time period.
% Ready displays the percentage of the virtual machine’s CPU resources that are ready to execute system code and user programs during the selected time period.
The Baseline area in the chart indicates the expected CPU utilization range based on historical data.
Figure 151. Virtual desktop CPU view
 | ||
|
The Network I/O spinner indicates the current rate at which the selected virtual machine transfers data from and to the network.
The Transfer Rate line in the Network Utilization chart shows the rate at which the selected virtual machine receives and sends data to the network during the selected time period.
The Baseline area in the chart indicates the expected network utilization range based on historical data.
Figure 152. Virtual desktop Network view
 | ||
|
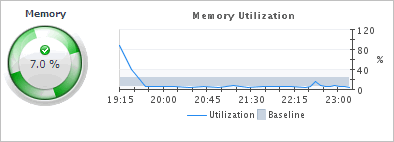
The Memory spinner indicates the current percentage of the average memory usage by the selected virtual machine, based on the total memory capacity.
The Utilization line in the Memory Utilization chart shows the percentage of memory used by the virtual machine during the selected time period.
The Baseline area in the chart indicates the expected memory utilization range based on historical data.
Figure 153. Virtual desktop Memory view
 | ||
|
The Datastore I/O spinner indicating the current datastore I/O rate the selected virtual machine utilizes, based on the total datastore capacity.
The Transfer Rate line in the Datastore Utilization chart shows the rate at which the virtual machine reads and writes data to the datastore during the selected time period.
The Baseline area in the chart indicates the expected datastore utilization range based on historical data.
Figure 154. Virtual desktop Datastore view
 | ||
|
Figure 155. Sessions view
| ||

|
• |
Application session: This tab displays the metrics for all processes associated with the session. |
|
• |
Desktop session: This tab displays the metrics for the top consumers of system resources. You can configure the number of top processes that you want to display using the topN XenDesktop Agent property. |

|
For each identified process, the CPU Usage chart displays the percentage of CPU resources used by the process during the selected time period.
Figure 158. CPU Usage view
 | ||
|
For each identified process, the Memory Usage chart displays the percentage of memory resources that are in use, during the selected time period.
Figure 159. Memory Usage view
 | ||
|
For each identified process, the Process I/O chart displays its data transfer rates, during the selected time period.
Figure 160. Process I/O view
 | ||
|
For each identified process, the Page Faults chart displays the number of page faults encountered each second, during the selected time period.
Figure 161. Page Faults view
| ||
|
Figure 162. Process Summary view
 | ||

|
1 |
|
2 |
|
3 |

|
4 |

|
5 |

