|
1 |
On the navigation panel, under Dashboards, click Management Server > Servers > Persistence Handler Overview. |
Foglight builds topology models at run-time using the data collected from your monitored systems, and keeps information related to monitored types indefinitely. Global Default setting can be used so objects are not kept indefinitely. Objects that are not expected to change or update are considered stale. These stale objects consume monitoring resources and can be cleaned up. If you have a very large number of stale objects, this may indicate a misconfiguration of your monitoring environment.
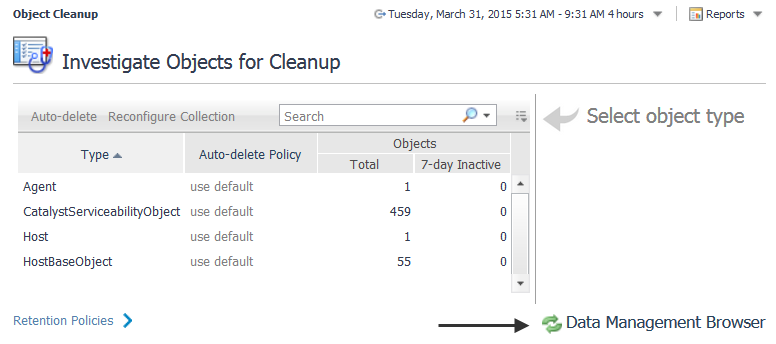
Use the Object Cleanup dashboard to remove stale objects, and to reconfigure your URL transformation rules if necessary.
|
• |
On the navigation panel, under Dashboards, click Management Server > Servers > Object Cleanup. |
|
2 |
|
IMPORTANT: After you type a new number in the since box, you must press Apply to ensure the value is updated. |
|
IMPORTANT: After you type a new number in the since box, you must press Apply to ensure the value is updated. |
|
9 |
|
2 |
Click Auto-delete. |
|
5 |
Click OK. |
You can also navigate to an advanced dashboard to set rollups per object, using the Manage Retention Policies dashboard in the Administration module. For more information, see Manage Data Retention.
To create a custom retention policy:
|
1 |
|
2 |
|
4 |
Click OK. |
|
1 |
|
2 |
Click the Data Management Browser link in the bottom right-hand corner. |
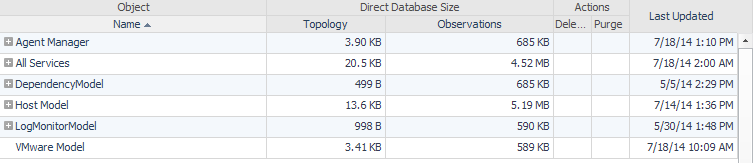
Use the Delete, Purge for objects, or Purge for types options in the header of the table to manage data objects.
Delete — Use this option to immediately delete the object, the object metric, or delete the object tree. You can choose whether to delete an object individually or delete its tree and also choose whether or not to delete the metrics associated with an object. For example, if you choose to delete a host, all data associated with the host is deleted.
Purge for objects — Use this option to schedule the removal of the observations for a selected object during the database off-hours maintenance cycle. By default, this maintenance is scheduled at the end of the month. For more information, see Purge data objects.
Purge for types — Use this option to schedule the removal of objects by types during the database off-hours maintenance cycle. By default, this maintenance is scheduled at the end of the month. For more information, see Purge data objects.
|
1 |
|
2 |
Click the Data Management Browser link in the bottom right-hand corner. |
|
5 |
|
7 |
Click Set. |
|
1 |
|
2 |
Click the Data Management Browser link in the bottom right-hand corner. |
|
4 |
|
5 |
Click Yes to the confirmation message Are you sure you want to delete this object and all of its children?. |
|
1 |
On the navigation panel, under Dashboards, choose Management Server > Servers > Management Server View. |
|
2 |
Click Choose a Foglight Server and select the server from one or more list entries that appear. |
|
• |
Rule Service: Shows the number of rule and derived metric instances bound to data objects. |
|
• |
Data Service: Shows the ability of the server to keep up with incoming data. |
|
• |
JVM: Shows the memory performance of the JVM in which the server is running. |
|
• |
JDBC Connection Pool: Shows the number of database connections that are in use or available at any time. |
|
• |
Derivation Service: Shows the number of derivation rulettes, errors, and evaluation counts. |
|
• |
Email Sender Service: Shows the number of emails that are sent from the selected Management Server. |
|
• |
FMS Database Size: Shows the size of the database. |
Foglight ships with a number of default object groups and subgroups. These groups are marked as Created by Foglight and cannot be changed or deleted.
|
1 |
|
4 |
Ensure the Is Disabled check box is cleared to enable the object group activation. |
|
5 |
Click Create. |
After creating an object group, you need to add one or more subgroups to that group. For more information, see Create an object subgroup.
|
2 |
|
• |
Name: Type a name for the object sub-group that is unique in Foglight. |
|
• |
Description: Optional — Type a description of the object subgroup. |
|
• |
Data Type: Type a regular expression that selects the data type of the subgroup. This is a mandatory value. For example, the following expression selects all Foglight agents with the exception of WindowsAgent instances: |
|
• |
Query Conditions: Optional — Type a filter expression that selects specific object instances only. For example, the following expression selects only those object instances that are already selected by the Data Type expression and whose name starts with ‘tor’: |
|
• |
Is Disabled: Ensure the check box is cleared to enable the subgroup activation. |
|
4 |
Click Test. |
|
5 |
Click Create. |
The object groups that are made available in the Tier Definitions dashboard are based on object groups that were created using the Object Groups dashboard. For more information, see Create an object group.
|
NOTE: New tiers are hidden by default in the Service Operations Console. To display a new tier, in the Service Operations Console, click Customize Service Operations Console, open the Tier Selector tab, and ensure the newly-created tier is selected. For more information about the Service Operations Console, see the related help page. |
|
1 |
The FMS Overview view is a starting point for performance analysis of the Foglight Management Server. It displays information about the database activity, data service performance, JVM performance, and server load in one unified view.
In federated environments, explore the diagnostics for each individual server: Federation Master, Federation Child, or a standalone Foglight Management Server. To do that, click Choose a Foglight Server and select a host from the list that appears.
This view provides more information on:
|
• |
Data load summary (Data Service, Inserts per 5 minutes views). In the Inserts per 5 min embedded view, num_rows_inserted_per5min shows the number of rows inserted every five minutes, while avg_insert_per5min shows one-hour average of num_rows_inserted_per5min. Spikes on the Data Service embedded view often indicate some kind of data processing lull such as a high amount of incoming data (seen as an increase in batchesProcessed), or insufficient resources to process incoming data decrease in batchesDiscarded). |
|
• |
Whether there is enough memory (JVM Memory Usage view). In this view, memory_usage shows the heap memory usage, totalMemory shows the amount of total heap memory, and freeMemory is the free heap memory. A sawtooth on the JVM memory graph is normal, but if the amount of memory freed by a garbage collect (such as the height of the sawtooth) is small, you may need more memory on your system. A large topology results in a high amount of incoming data and a decrease in free memory. The amount of free memory should never be zero. If it does reach zero this is an indication to adjust the server configuration. |
|
• |
Whether the load on the server is too high (Server Load Status view). Server load is mostly determined by the memory usage in the JVM old generation. If the server runs out of memory it will go into an “overloaded” state. A server can be in this state and have some memory available in the JVM new generation. If that is the case, the server discards incoming agent data but can continue to service browser interface requests to some degree. If the server remains to be overloaded, it likely needs to be re-configured to have more memory available, or less workload coming from the browser interface and/or the agents. |
 |
||
 |
Incoming data spikes (batchesProcessed increases), slow processing (batchesDiscarded increases) | |
 |
Too large topology, too much incoming data (freeMemory increases) | |
 |
The Agents view is designed to see what agents you are running, listed by type. By selecting agent types in the tree, a graph showing the number of agents as a function of time is plotted. This graph is handy for viewing changes to the agents, for example if a number of agents that you did not know about were added, or checking if old agents are properly removed.
|
1 |
From the navigation panel, click Dashboards > Management Server > Diagnostic > Performance. |
|
2 |
|
3 |
To view agent connectivity, in the Agent Type column, drill-down to the agent type to view its connectivity. |
The Baseline Measurements view shows internal database I/O statistics related to baseline computation. A metric baseline is the expected metric range for the given time period. When configured, IntelliProfile computes baselines for metrics, and stores that data in the database.
|
1 |
From the navigation panel, click Dashboards > Management Server > Diagnostic > Performance. |
|
2 |
In the display area, click FMS Overview, and in the list that appears, select Baseline Measurements. |
 |
||
 |
||
 |
||
 |
||
 |
||
 |
||
 |
||
 |
||
 |
The Connectivity view shows the Foglight connectivity for the JDBC connection pool and the user session count. It summarizes the database connection state from the perspective of the Foglight Management Server. By looking at this view, you can determine if there are enough JDBC connections to service application requests.
|
1 |
From the navigation panel, click Dashboards > Management Server > Diagnostic > Performance. |
|
2 |
 |
||
 |
The Database Overview view displays the metrics that represent the reads, inserts, and updates of the database rows. These metrics can be used in performance load tests to track the unit load.
Contents of this view includes a drop down to select the host name. Here, you can select a Federation Master, Federation Child, or standalone server. To do that, click Choose a Foglight Server and select a host from the list that appears. It also contains the following embedded views:
|
1 |
From the navigation panel, click Dashboards > Management Server > Diagnostic > Performance. |
|
2 |
 |
||
 |
High load may indicate a possible database bottleneck. Check the database specifications. | |
 |
May indicate a dirty database buffer, possibly because the innodb pool buffer is too small. | |
 |
|
• |
Copy: This view shows the activity of the ParNew garbage collector, used to reclaim memory in the JVM new generation part of the heap. In most cases, there is no need to be concerned with the data on this view unless the numbers become unreasonable (one hour or higher). |
|
• |
ConcurrentMarkSweep: This view shows the activity of the ConcurrentMarkSweep garbage collector, used to reclaim memory in the JVM old generation part of the heap. In general, the values appearing on this view should stay low. An occasional spike does not indicate any problems (such as once a day). If spikes become frequent, the Foglight Management Server memory allocation may need to be adjusted (for example, by balancing the size of new and old generations). In some cases it might be required to increase the overall Foglight Management Server heap. |
|
1 |
From the navigation panel, click Dashboards > Management Server > Diagnostic > Performance. |
|
2 |
The Java Virtual Machine (JVM) view provides full details on the JVM memory activity. This view is particularly useful if you are performing detailed JVM tuning for the different memory spaces.
|
1 |
From the navigation panel, click Dashboards > Management Server > Diagnostic > Performance. |
|
2 |
In the display area, click FMS Overview, and in the list that appears, select Java Virtual Machine Memory. |
The Rulette and Topology view shows how many rules and rule instances are running. Many rulettes, especially as a function of the number of objects, can indicate that you are overloading your server or if some old rules are still running.
|
1 |
From the navigation panel, click Dashboards > Management Server > Diagnostic > Performance. |
|
2 |
In the display area, click FMS Overview, and in the list that appears, select Objects - Rulette and Topology. |
|
1 |
From the navigation panel, click Dashboards > Management Server > Diagnostic > Performance. |
|
2 |
In the display area, click FMS Overview, and in the list that appears, select Script Invocation Time. |
This view shows the Foglight Management Server load metrics and JVM performance.
|
1 |
From the navigation panel, click Dashboards > Management Server > Diagnostic > Performance. |
|
2 |
This view highlights the data and metrics that are being processed in time or getting discarded.
The Service - Data & Message view shows details on data handling of the Foglight Management Server such as the number of skipped messages and the number of discarded metrics. The top-right embedded view shows the percentage of data that is dropped by the server over time, while the top-left embedded view shows the counts of total and skipped messages over time. A high percentage of dropped data can often indicate a server overload. The embedded view in the bottom right is useful for indicating how long data processing is expected to take. If that value grows over time, that is a good indication that the Foglight Management Server cannot keep up with the load from the agents.
|
1 |
From the navigation panel, click Dashboards > Management Server > Diagnostic > Performance. |
|
2 |
In the display area, click FMS Overview, and in the list that appears, select Service - Data and Message. |
The Service - Derivation and Query view shows activity in the derivation and query service such as the number of evaluations, rulettes, errors, and cache performance.
|
1 |
From the navigation panel, click Dashboards > Management Server > Diagnostic > Performance. |
|
2 |
In the display area, click FMS Overview, and in the list that appears, select Service - Derivation and Query. |
The Service - Persistence view shows metric details for the Foglight Management Server that is related to:
|
1 |
From the navigation panel, click Dashboards > Management Server > Diagnostic > Performance. |
|
2 |
In the display area, click FMS Overview, and in the list that appears, select Service - Persistence. |
The Service - Topology & Agent Manager is a two-part view.
|
1 |
From the navigation panel, click Dashboards > Management Server > Diagnostic > Performance. |
|
2 |
In the display area, click FMS Overview, and in the list that appears, select Service - Topology and Agent Manager. |
The UI Query Time view is similar to the Script Invocation Time view (see page 205) except that it shows tables for a query instead of a script.
|
1 |
From the navigation panel, click Dashboards > Management Server > Diagnostic > Performance. |
|
2 |
Some Foglight dashboards have reports associated with them. This allows you to run a report based on the current dashboard. You can generate the report using the Reports menu in the top-right corner.
The Performance Overview dashboard and Management Server View are associated with the Management Server Performance Summary Report. Run this report by choosing Management Server Performance Summary Report from the Reports menu, and specifying the input parameters in the report wizard.