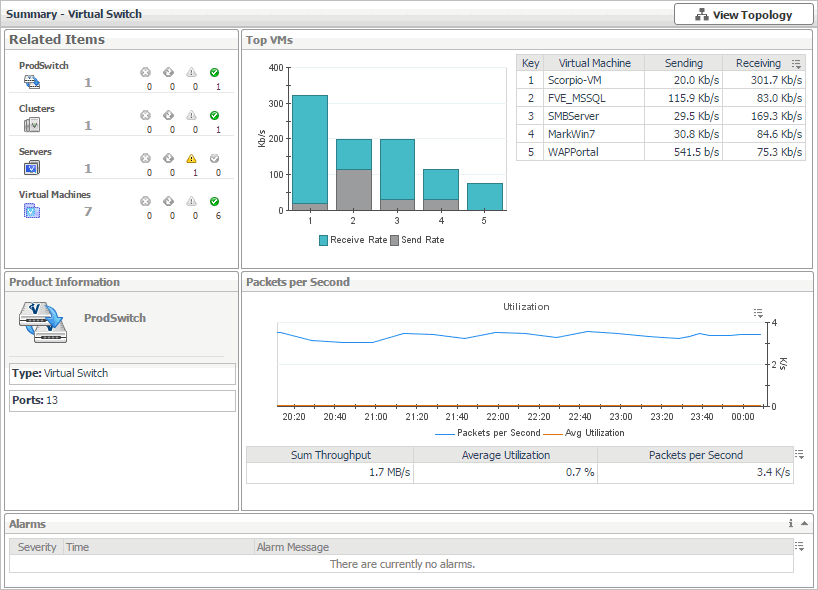
Summary - Virtual Switch view
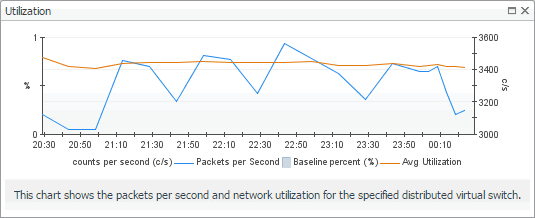
The Summary - Virtual Switch view illustrates the overall network utilization and the levels of overall network traffic for a selected virtual switch.
This view appears in the Quick-View on the left when you select a virtual switch in the Virtual Switches view.
This view is made up of the following embedded views:
|
|
Shows the numbers and states of the objects in your environment associated with the selected virtual switch. |
|
|
|
• |
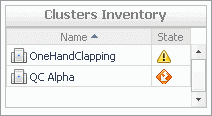
Clusters. The number of clusters associated with the selected virtual switch, followed by the related alarm counts. | |
|
|
|
• |
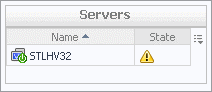
Servers. The number of servers associated with the selected virtual switch, followed by the related alarm counts. | |
|
|
|
• |
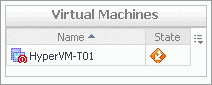
Virtual Machines. The number of virtual machines that are associated with the selected virtual switch, followed by the related alarm counts. | |
|
|
|
• |
Virtual Switch. Represents the selected virtual switch. Shows the counts of alarm generated against the switch. | |
|
|
Drill down on: |
|
|
|
• |
Clusters. Displays the Clusters dwell, showing the names and states of all clusters that are associated with the selected virtual switch. |
|
|
|
|
• |
Servers. Displays the Servers dwell, showing the names and state of the servers associated with the selected virtual switch. |
|
|
|
|
• |
Virtual Machines. Displays the Virtual Machines dwell, showing the names and states of all virtual machines that are associated with the selected virtual switch. |
|
|
|
|
• |
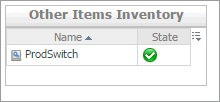
Virtual Switch. Displays the Other Items Inventory dwell, showing the state of the selected virtual switch. |
|
Virtual Switch Topology view
A typical Hyper-V environment consists of many interrelated components. Understanding the dependencies between virtual switches and other components of your monitored environment allows you to better understand resource-related issues, potentially affecting the stability of your system. This can help you predict the impact a potential outage may have on your environment, and to prevent such events, by reallocating resources where they are most needed.
The Virtual Switch Topology View visualizes the relationships between the objects in your environment through an interactive map. The map illustrates how different components relate to each other, and the levels of the available resources available to them.
This view appears in the display area when you click View Topology In the Summary - Virtual Switch view.
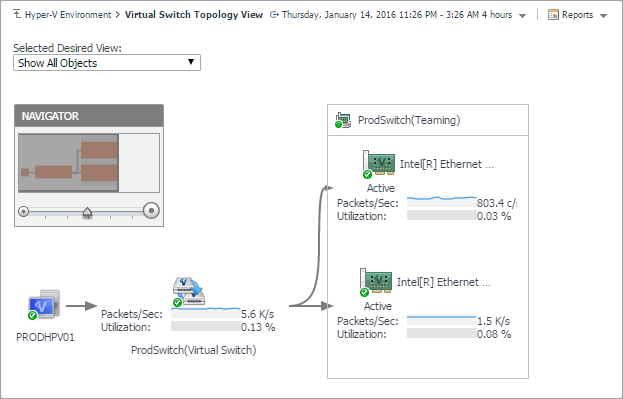
The complexity of the information appearing in a dependency map depends on the selected object and the dependencies that object has with other objects within your integrated infrastructure.
In a large multi-component environment, dependency maps are likely complex and may not fit your screen. The NAVIGATOR in the top-right corner allows you to easily set the zoom level by dragging the slider into the appropriate position.

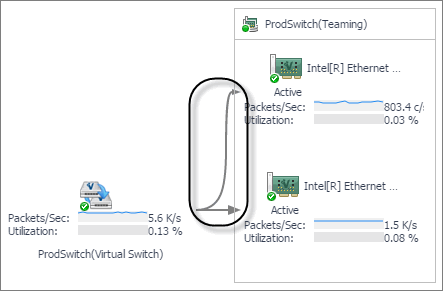
In a dependency map, some objects are represented with container tiles, others with single-object tiles or just icons. Every object in the map includes an indicator of its health.

Dependencies between the objects in a map are illustrated with single-directional arrows. The color of the arrow reflects the alarm state of the target object: gray for Normal, yellow for Warning, orange for Critical, and red for the Fatal state.
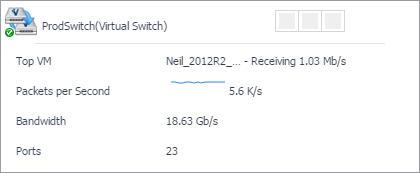
To find out more about an object appearing in the dependency map, click the object icon. A dwell appears, displaying more details about that object. The type and range of information appearing in the dialog box depends on the selected object’s type. For example, drilling down on a virtual switch shows the switch name, alarm counts top virtual machine consumers, levels of traffic utilization, percentage of packet loss, current traffic types, available bandwidth, the numbers of available and all ports, and the number of active versus standby NICs.
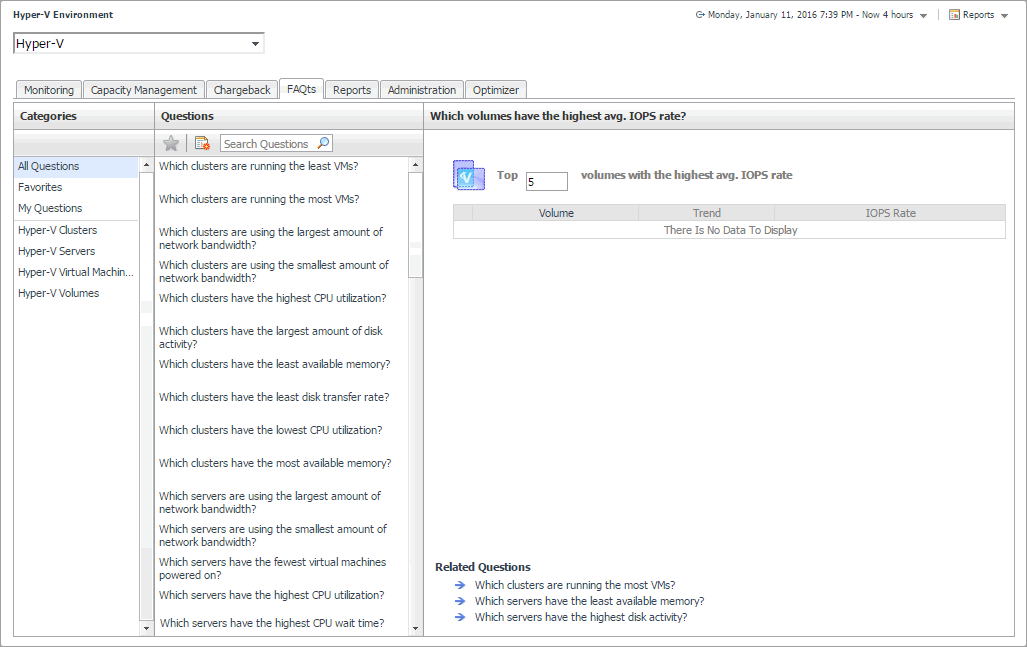
About frequently asked questions
The Hyper-V Environment dashboard contains the FAQts tab that you can use to ask questions about your monitored systems and review the answers. In the Categories pane, the FAQts view shows several question categories. Clicking a category shows the questions belonging to that category in the Questions pane. From there, clicking a question shows the answer on the right.
This tab also appears in the Hyper-V Explorer. For reference information about this tab, see Hyper-V Explorer FAQts.
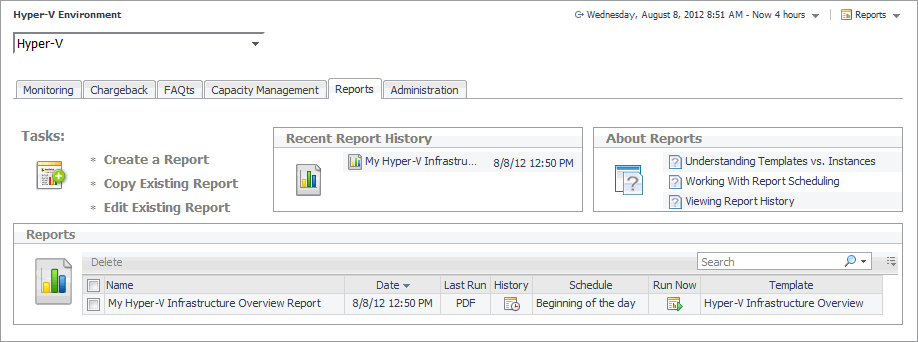
About reports
Hyper-V Monitoring in Foglight Evolve Cloud includes a report generation ability. This allows you to create reports using a set of predefined templates to report on the various aspects of your database environment. Hyper-V Monitoring in Foglight Evolve Cloud includes a collection of predefined report templates.
You can generate, copy, and edit reports using the Reports tab on the Hyper-V Environment dashboard, or alternatively the Reports dashboard included with the Management Server.
For more information on how to use this tab to create and manage reports, see the Managing Capacity in Virtual Environments User Guide. For more information about the Reports dashboard, see the Foglight Evolve Cloud User Help.