Web Monitor Environment view
The Web Monitor Environment view displays a high-level overview of your monitored environment. The view has two tiles, each representing the monitored objects of interest Transactions and Locations.
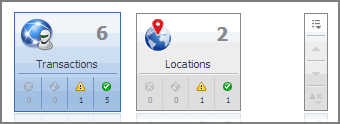
Each tile shows how many of the corresponding object instances there are in your monitored infrastructure, as well as the count of objects of that type in each of the alarm states Normal  , Warning
  , Critical
  , or Fatal
  ). For example, the following image shows six transactions: none in the Fatal or Critical states, one in Warning, and one the Normal state.
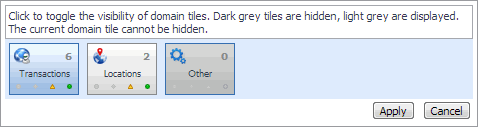
You can move the tiles by dragging and dropping until you achieve the desired layout. To hide one or more tiles, on the tool bar on the right, click  , and in the popup that appears, click a tile that you want to hide.
Clicking the object type icon, the object type name, or the object count, shows summary information for that object type in the Quick View. Clicking an alarm state (for example, Warning) on a tile displays summary information in the Quick View for the objects of that type that are in the selected alarm state. If an alarm state has a count of zero, then you can not drill down on the alarm state.
This view appears in the upper part of the Performance Browser, just above the Quick View.
This view is made up of the following embedded views:
Web Monitor Transaction Management views
The Transaction Management dashboard contains the following views:
Transaction Detail view
The Transaction Detail view provides details about the selected transaction. Use it to find out the URL of the monitored Web site, the type of monitored content, the locations from which this Web site is monitored, and to review and adjust some advanced settings, if needed.
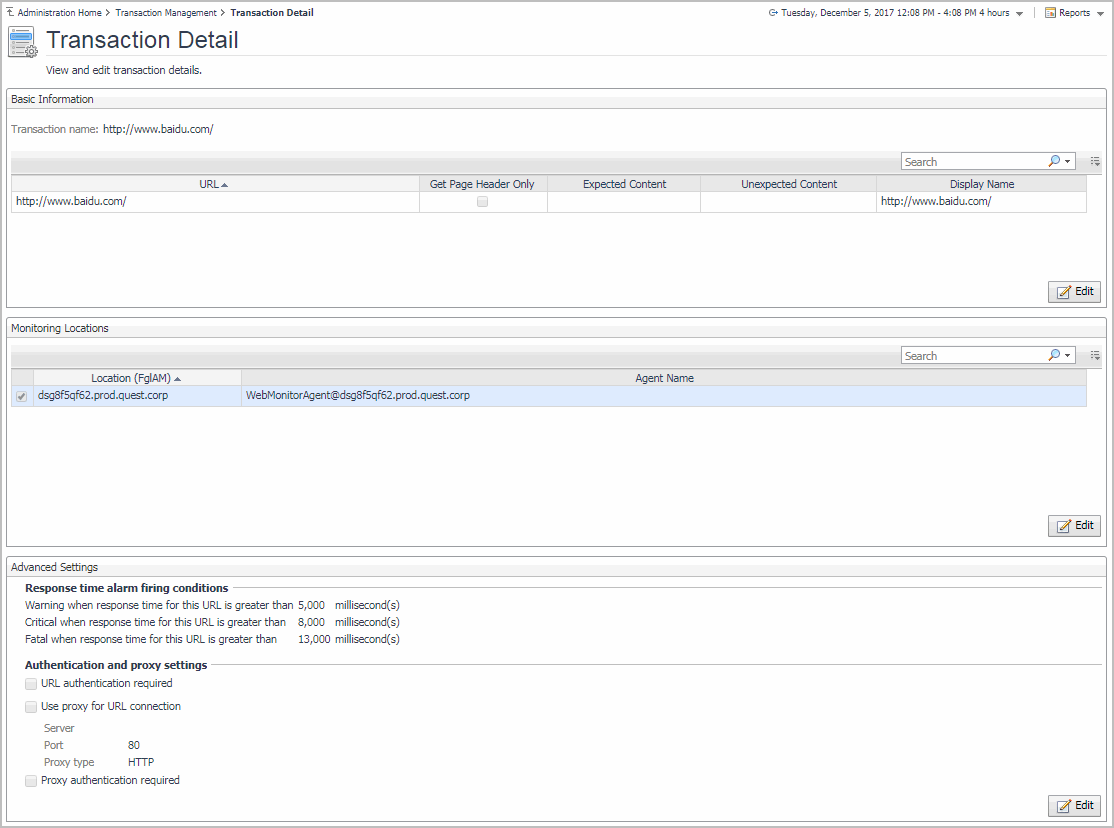
The Transaction Detail view appears in the display area.
This view is made up of the following embedded views:
|
|
Shows the URL of the monitored Web site. It also indicates whether the agent should retrieve the page header only, and the expected content. |
|
|
|
• |
Expected Content: If content validation is enabled for the agent instance that monitors this URL, and the expected content type is HTML-based, this is indicated in this column. Also, a text string could be used such as “laptop” and type laptop into this column. In case the monitoring agent detects binary content or the text string at this address, the validation fails and the agent logs an error message. If this column is empty, that means the agent is not required to perform content validation. Content validation can be enabled using the URL List secondary agent properties. For more information, see Settings. |
|
• |
Unexpected Content: If unexpected content validation is enabled for the agent instance that monitors this URL, and the unexpected content type is HTML-based, this is indicated in this column. Also, a text string could be used such as “laptop” and type laptop into this column. In case the monitoring agent detects binary content or the text string at this address, the validation fails and the agent logs an error message. If this column is empty, that means the agent is not required to perform unexpected content validation. Unexpected Content validation can be enabled using the URL List secondary agent properties. For more information, see Settings. |
|
• |
URL. The URL of the monitored Web site. | |
Transaction Management table
The Transaction Management table displays a list of monitored Web sites and helps you understand which locations monitor them. It provides insight into the complexity of your monitored environment.

|
|
|
• |
Active Agents. The number of active Web Monitor Agent instances that currently monitor this Web site out of the total number of agents configured to collect data from it. For example, 1/2 means that only one active agent currently monitors this transaction out of two configured agents. |
|
• |
Locations. The names of the hosts running the Web Monitor Agent instances that currently monitor this Web site. |
|
• |
URL. The URL of the monitored Web site. | |
|
|
Drill down on:
|
