This section applies only to Foglight systems.
The appearance of the Welcome page and the range of dashboards you can access from this page vary depending on your user role. If you have Administrator-level permissions, you can access advanced dashboards and configuration workflows. See the Administration and Configuration Guide. Users with the Operator role (but not the Administrator role) have permission to access a smaller set of dashboards.
By default, the time range at the top of a dashboard is in real time. When the dashboard’s time range is in real time, the icon and the word Now appear in the time range display.
In some cases, the alarm might occur close enough to the current moment that the last quarter of the diagnostic time range would cover a span of time that is in the future. If that is the case, Foglight sets the diagnostic time range to end at the current moment (shown as Now in the time range display).
Unfreezing the time range causes it to revert to the last monitoring time range that you used. For more information on current and diagnostic time ranges, see “Time range” in the Foglight User Help.
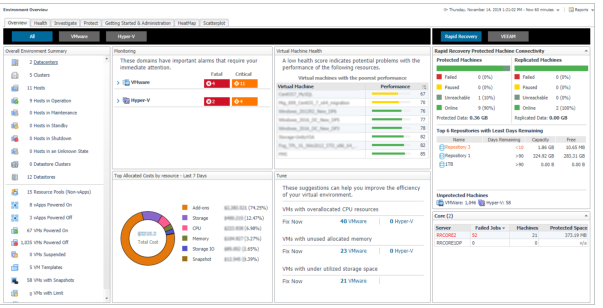
This section provides an introduction to the Foglight Evolve Environment Overview dashboard. When you log in to Foglight Evolve for the first time, the Environment Overview dashboard > Overview tab is displayed.
The Overview tab shows the overall status of your virtual environment, and highlights various objects that need further exploration. You can select to view all or specific domains in your virtual environment, by clicking the All, VMware, or Hyper-V button, respectively, located on the top right corner of the tab. The Overview tab includes the following views:
|
• |
Overall Environment Summary. Provides a summary of your virtual environment. |
|
• |
Monitoring. Highlights the alarms that need immediate attention, for each monitored domain. Drill down into the available links, to review the alarms in more detail. |
|
• |
Virtual Machine Health. Provides a list of virtual machine with the lowest health score in your environment. To investigate the potential problems affecting the health of a resource, click the virtual machine name or the performance icon. |
|
• |
Top Allocated Costs by resource - Last 7 Days. Provides a list of the top allocated costs by resource within the last 7 days. |
|
• |
Tune. Provides a list of suggestions for making your virtual environment more efficient. Clicking the Fix Now link opens the Optimizer Main View dashboard, which allows you to optimize your environment, as necessary. |
|
• |
Rapid Recovery/VEEAM. Provides an overview about the protected and unprotected virtual machines in the monitored environment. |
|
• |
Protected Machines. Shows the connectivity state of machines protected on the monitored Rapid Recovery core. |
|
• |
Replicated Machines. Shows the connectivity state of machines replicated on the monitored Rapid Recovery core. |
|
• |
Top 6 Repositories with Least Days Remaining. Shows the top six repositories with the least days remaining on the monitored Rapid Recovery core. Drill down into the server names, to navigate to the Protection > Repositories Capacity Planning dashboard. |
|
• |
Unprotected Machines. Shows the amount of unprotected machines. Drill down into the unprotected machines, to navigate to the Protection > Protected Status dashboard. |
|
• |
Core Servers. Lists the monitored Rapid Recovery Core Servers. Drill down into the server names, to navigate to the Protection > Rapid Recovery Infrastructure dashboard. |
|
• |
Protected VMs/Restore Points. Shows the number of protected VMs (backed up or replicated), number of restore points available, source VM size, full and incremental backup size, and successful backup sessions ratio on the monitored VEEAM Backup Server. |
|
• |
Top 6 Repositories with Least Days Remaining. Shows the top six repositories with the least days remaining on the monitored Rapid Recovery core. Drill down into the server names, to navigate to the Protection > Repositories Capacity Planning dashboard. |
|
• |
Unprotected Machines. Shows the amount of unprotected machines. Drill down into the unprotected machines, to navigate to the Protection > Protected Status dashboard. |
|
• |
Backup Servers. Lists the Backup Servers in VEEAM Infrastructure. Drill down into the server names, to navigate to the Protection > VEEAM Infrastructure dashboard. |
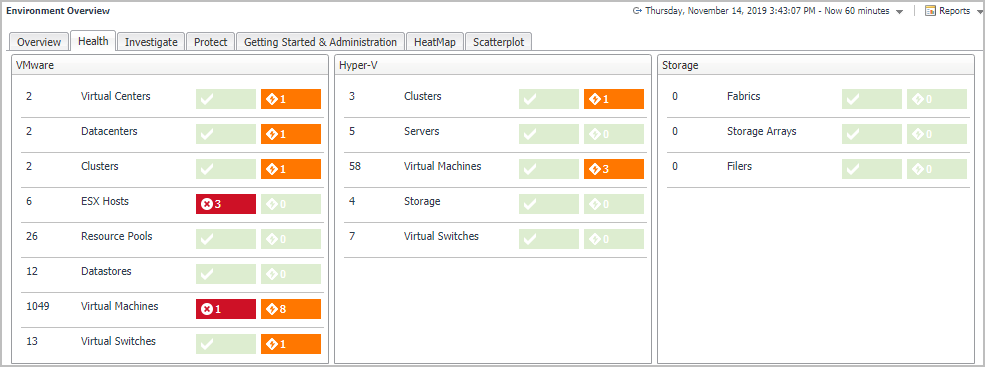
The Environment Overview dashboard also includes a Health tab, which allows you to review the health of your virtual environment. This tab includes the following views:
|
• |
VMware. Highlights the alarms that need immediate attention, in your VMware® environment. Drill down into the available links, to review the alarms in more detail. |
|
• |
Hyper-V. Highlights the alarms that need immediate attention, in your Hyper-V® environment. Drill down into the available links, to review the alarms in more detail. |
|
• |
Storage. Highlights the alarms that need immediate attention, in your Storage Management environment. Drill down into the available links, to review the alarms in more detail. |
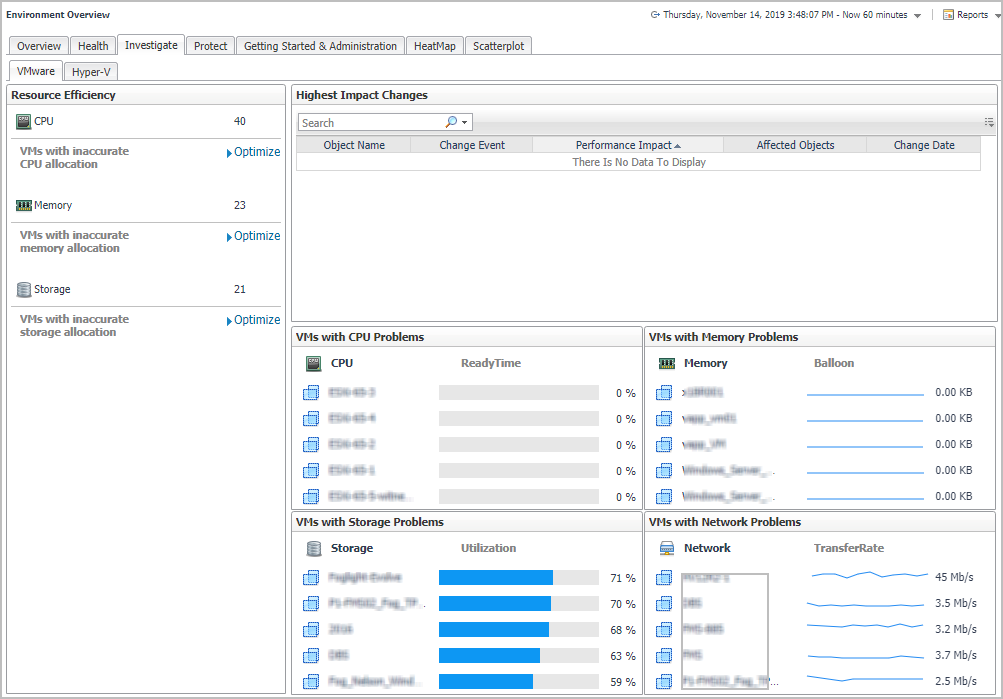
The Environment Overview dashboard also includes an Investigate tab, which provides a quick way to investigate the resource efficiency in your environment and to optimize VMs with incorrect resource allocations, as necessary. The Investigate tab includes the VMware and Hyper-V tabs, with the following views:
|
• |
VMware tab: |
|
• |
Resource Efficiency. Provides a list of suggestions for making your virtual environment more efficient, for each type of virtual object (CPU, Memory, and Storage). Clicking the Optimize links opens the Optimizer Main View dashboard, which allows you to optimize your environment, as necessary. |
|
• |
Highest Impact Changes. Provides an overview of changes with the highest impact on your environment. |
|
• |
VMs with CPU Problems. Provides a list of virtual machines experiencing the highest CPU utilization. Clicking a virtual object to drill down and investigate the issues in more details. |
|
• |
VMs with Memory Problems. Provides a list of virtual machines experiencing the highest memory utilization. Clicking a virtual object to drill down and investigate the issues in more details. |
|
• |
VMs with Storage Problems. Provides a list of virtual machines experiencing the highest storage utilization. Clicking a virtual object to drill down and investigate the issues in more details. |
|
• |
VMs with Network Problems. Provides a list of virtual machines experiencing the highest network transfer rate. Clicking a virtual object to drill down and investigate the issues in more details. |
|
• |
Hyper-V tab: |
|
• |
Resource Efficiency. Provides a list of suggestions for making your virtual environment more efficient, for each type of virtual object (CPU and Memory). Clicking the Optimize links opens the Optimizer Main View dashboard, which allows you to optimize your environment, as necessary. |
|
• |
VMs with CPU Problems. Provides a list of virtual machines experiencing the highest CPU utilization. Clicking a virtual object to drill down and investigate the issues in more details. |
|
• |
VMs with Memory Problems. Provides a list of virtual machines experiencing the highest memory utilization. Clicking a virtual object to drill down and investigate the issues in more details. |
|
• |
VMs with Storage Problems. Provides a list of virtual machines experiencing the highest storage utilization. Clicking a virtual object to drill down and investigate the issues in more details. |
|
• |
VMs with Network Problems. Provides a list of virtual machines experiencing the highest network transfer rate. Clicking a virtual object to drill down and investigate the issues in more details. |
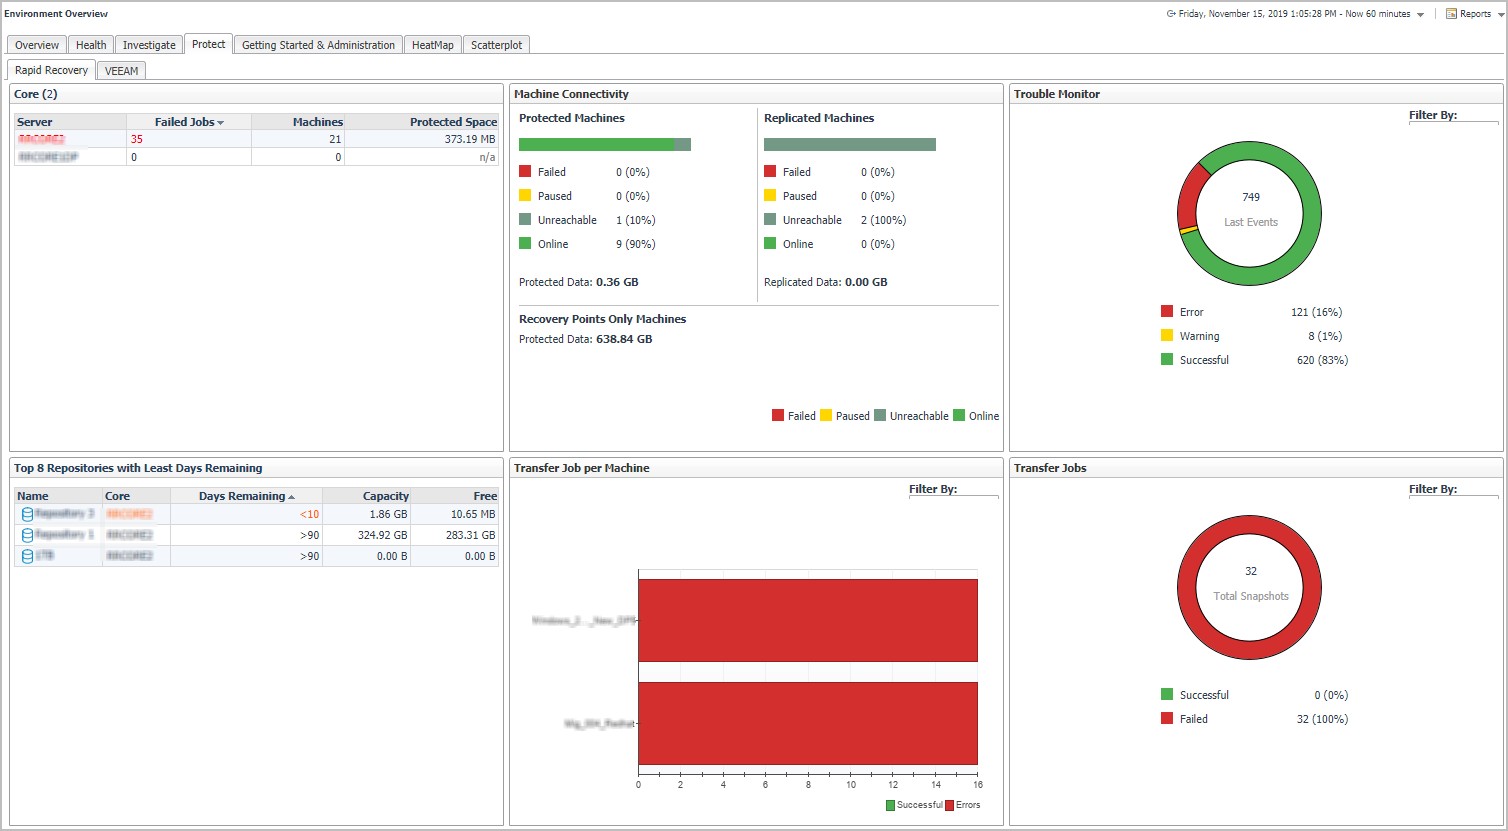
The Environment Overview dashboard also includes a Protect tab, which allows you to review the of your virtual environment. The Protect tab includes the Rapid Recovery and VEEAM tabs with the following views:
|
• |
Rapid Recovery tab |
|
• |
Core Servers. Lists the monitored Rapid Recovery Core Servers. Drill down into the server names, to navigate to the Protection > Rapid Recovery Infrastructure dashboard. |
|
• |
Machine Connectivity. Shows the connectivity state of machines protected and replicated on the monitored Rapid Recovery core. It also shows connectivity for data on recovery points-only machine. |
|
• |
Trouble Monitor. Shows job activity, connections with the license portal, and transfer activity to detect early on the monitored Rapid Recovery core. The time range is configurable, defaulting to last 24 hours. Click this view to navigate to the Protection > Events > Journal dashboard. |
|
• |
Top 8 Repositories with Least Days Remaining. Shows the top eight repositories with the least days remaining on the monitored Rapid Recovery core. Drill down into the server names, to navigate to the Protection > Repositories Capacity Planning dashboard. |
|
• |
Transfer Job per Machine. This table shows, by protected machine of which the latest transfer job is failed, the number of successful and failed transfer jobs in the specified time range. There is no data displayed if all transfer jobs are successful. Click this view to navigate to the Protection > Events > Tasks dashboard. |
|
• |
Transfer Job. Shows all snapshot data transfers (including base images and incremental snapshots) that completed in the specified time range. The time range is configurable, defaulting to last 24 hours. Click this view to navigate to the Protection > Events > Tasks dashboard. |
|
• |
VEEAM tab |
|
• |
Backup Servers. This table lists the monitored VEEAM Backup Core Servers. Click this link to navigate to the VEEAM Infrastructure Tab. |
|
• |
Protected VMs Overview. This table presents the information about how your VMs are protected, number of protected VMs (backed up or replicated), number of restore points available, source VM size, full and incremental backup size, and successful backup sessions ratio on the monitored VEEAM Backup Server. |
|
• |
Backup Window. This table shows the total duration of Backup and Replication jobs. |
|
• |
Top 8 Repositories with Least Free. This tables shows the top eight repositories with the least days remaining on the monitored VEEAM Backup server. Click this link to navigate to the Repositories Capacity Planning Tab - VEEAM. |
|
• |
Transfer Job per Machine. This table shows, by protected machine of which the latest transfer job is failed, the number of successful and failed transfer jobs in the specified time range. This table shows the top ten machines with the most failed transfer job. The time range is configurable, defaulting to last 24 hours. Click this graph to navigate to the Jobs tab. |
|
• |
Transfer Jobs. This table shows all snapshot data transfers (including base images and incremental snapshots) that completed in the specified time range. The time range is configurable, defaulting to last 24 hours. Click this graph to navigate to Jobs tab. |
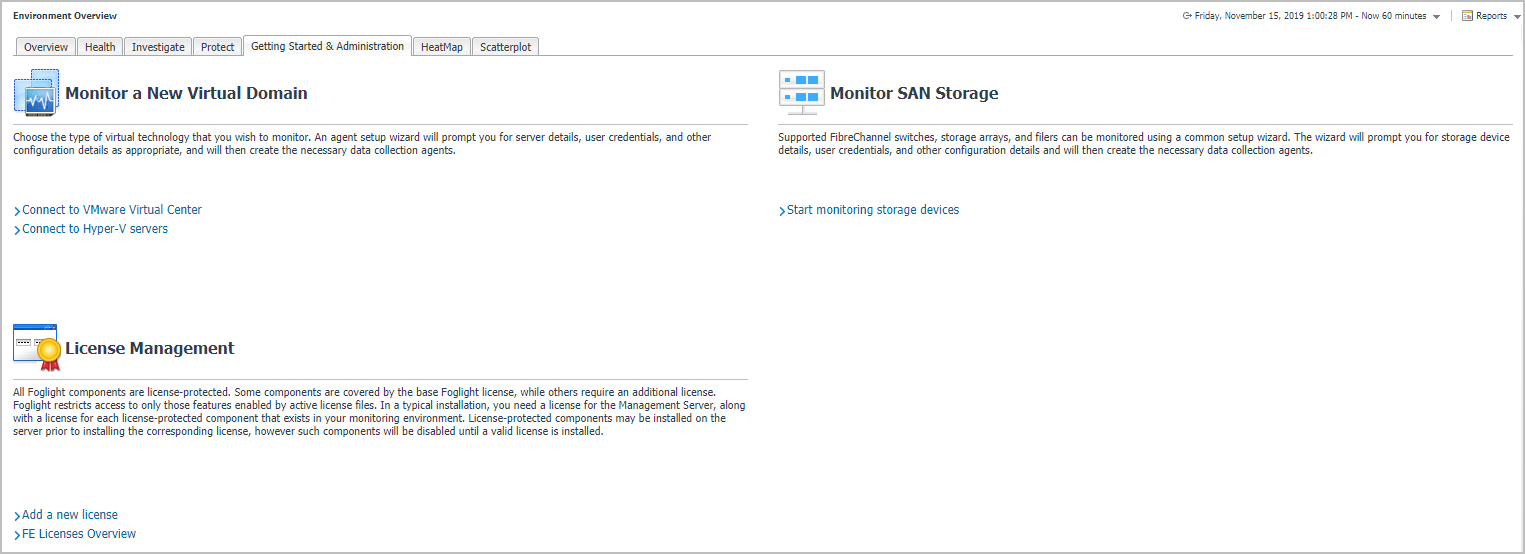
The Environment Overview dashboard also includes a Getting Started & Administration tab, which allows you to perform the following activities:
|
• |
Monitor a new virtual domain. Depending on the virtual technology that you want to monitor, select one of the following options: |
|
• |
Connect to a VMware Virtual Center. Launches a wizard to start the creation and configuration of a VMware Performance agent. |
|
• |
Connect to Hyper-V servers. Launches a wizard to start the creation and configuration of one Hyper-V agent or more Hyper-V agents of all servers (for target environment by batch). |
|
• |
Monitor SAN Storage. Allows you to monitor the SAN Storage, provided that the Storage Management license trial has been activated. |
|
• |
Start monitoring storage devices. Launches a wizard to start creating Storage Management agents. For more information, see the Foglight for Storage Management User and Reference Guide. |
|
• |
License Management. Allows you to manage the licenses for components installed with Foglight or Foglight Evolve, but not enabled. |
|
• |
Add a new license. Allows you to quickly access the Manage Licenses dashboard. For more information on licenses, see the Foglight Administration and Configuration Guide. |
|
• |
FE Licenses Overview. Allows you to get an overview of the Foglight Evolve licenses from this page. |
The Environment Overview dashboard also includes a HeatMap tab and a Scatterplot tab.
|
• |
HeatMap tab. Shows a Heat Map of the virtual machines monitored in the VMware or Hyper-V environment. |
|
• |
Scatterplot tab. Shows a Scatterplot of the virtual machines monitored in the VMware or Hyper-V environment. |