By default, the following columns are displayed:
|
• |
Alarms: The numbers of Fatal, Critical, and Warning alarms generated against each client, color-coded to indicate the severity. |
|
• |
Name: The name of the credential client. |
|
• |
Client Type: The credential client type. For example, FglAM (Foglight Agent Manager). |
|
• |
Assigned Lockboxes: The name of the lockbox released to the credential client. |
|
• |
Host: The name of the monitored host on which the client is running. |
Selecting the check box Show lockboxes currently assigned to each client causes the Credential Client column on the Manage Lockboxes dashboard to be populated. For more information about the Manage Lockboxes dashboard, see Explore the Manage Lockboxes dashboard .
Use this view to access some of the most common tasks in Foglight, as an alternative to the navigation panel. The following table lists the entries on the Administration dashboard and provides links to the associated dashboards or views.
|
Configure Rules and Metric Calculations to Discover Bottlenecks | ||||
|
Download Foglight agent components using the browser interface | ||||
Use this view to access administrative tasks, as an alternative to the navigation panel. The following table lists the entries in the Administration dashboard and identifies the dashboards or views that they link to.
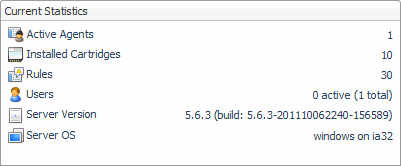
The Current Statistics view contains information about the installed cartridges, active agents, rules, users, and the Foglight Management Server configuration.
This view displays the following information:
|
• |
Active Agents shows the number of current agent instances. Each Foglight agent is a process that monitors a specific part of your environment, such as an operating system, application, or server. This number gives you a rough idea on how much data is coming into the Foglight Management Server. If you have no active agents, there is probably a connectivity issue between the agents and Foglight Management Server. If that number is lower than you think it should be, clicking this entry drills down to the Agent Status dashboard. Use this dashboard to find out which agent instances are not connected. |
|
• |
Installed Cartridges shows the number of Foglight cartridges in your system. A Foglight cartridge contains components that encapsulate a specific Foglight functionality. Your monitoring environment includes a set of server-specific cartridges, as well as additionally installed Foglight cartridges that are designed to monitor a specific type of environment. This number includes both the cartridges that come with the Foglight Management Server, and any other installed cartridges that exist in your system. Clicking this entry drills down to the Cartridge Inventory dashboard. Use this dashboard to view the list of all cartridges that exist in your monitoring environment. |
|
• |
Rules shows the number of rules that exist in your monitoring environment. This number includes the rules that come with the Foglight Management Server, any installed cartridges, and also any rules that you create. It gives you an idea of how much business logic is running on your server. That number is proportional to the number of cartridges you deploy. It is also a good general indicator of the environment complexity. The more rules you have, the more work the server is doing to analyze the data and generate alarms. Clicking this entry drills down to the Manage Rules dashboard. Use this dashboard to view, edit, and create rules. |
|
• |
Users shows how many active users are currently logged in, and the total number of users logged into Foglight. They also give you an idea how many people are accessing Foglight. If the users experience slow response, that might be caused by a large number of users and you might want to consider using federation to separate users’ actions from data processing. Clicking this entry drills down to the Manage Users dashboard. Use this dashboard to view and create users. |
|
• |
Server Version contains the server and build version numbers. Clicking this entry drills down to the Foglight Configuration dashboard. Use this dashboard to view the server configuration. |
|
• |
Server OS identifies the operating system of the computer on which the Foglight Management Server is installed. Clicking this entry drills down to the Foglight Configuration dashboard. Use this dashboard to view the server configuration. |
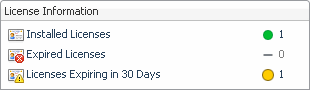
The License Information view contains information about one or more installed licenses. Expired Foglight licenses can cause unwanted behavior and this can be prevented by ensuring that your Foglight licenses are valid and up to date. Clicking an entry in this view drills down to the Manage Licenses dashboard. Use this dashboard to view and install Foglight license.
A Foglight license, typically distributed as in a foglight.license file, contains the information about the capabilities that are licensed. Installing this file on the Foglight Management Server enables all of the licensed capabilities.
This view displays the following information:
|
• |
Installed Licenses contains the total number of all installed Foglight licenses that exist in your system, including current and expired licenses. |
|
• |
Expired Licenses contains the number of expired licenses that exist in your system. |
|
• |
Licenses Expiring in 30 Days contains the number of licenses that will expire in the next 30 days. |
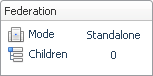
The Federation view contains information about the server federation. Federation is a Foglight feature that allows you to monitor large environments that are partitioned into logical units, where each unit acts as a data source, managed by a Foglight Management Server instance (Federated Server), and a Federation Server, that manages the operation of those units, merging their data into a central model. Clicking an entry in this view drills down to the Foglight Server Topology view.
This view displays the following information:
|
• |
Mode tells you whether the current Foglight Management Server installation is a child (Federated Server) or a master (Federation Server) in a federated system. |
|
• |
Standalone indicates that your server is a Federated Server, or that your monitoring environment is not federated. |
|
• |
Master indicates that the server is a Federation Server. |
|
• |
Children contains the number of children of the current Foglight Management Server installation in a federated system. If this setting shows zero ‘0’, combined with the Federation Mode value of Child/Standalone, that is a good indicator that your monitoring environment is not federated. |
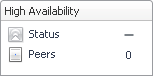
The High Availability view indicates if Foglight is running in High Availability (HA) mode. Configuring Foglight in HA mode allows you to run multiple servers in a JBoss partition offering HA. For more information on starting Foglight in High Availability mode, see the Installation and Setup Guide set.
This view displays the following information:
|
• |
|
• |
Peers shows the number of servers in the cluster, not including the current server. |
|
1 |
|
3 |
|
4 |
Type the message subject in the Subject box in the Send Message to All Users dialog box. For example: |
|
5 |
In the Message box, type the message text. For example: |
|
6 |
|
8 |
Click Send. |
|
c |
To delete all messages, click Clear All. |
|
d |
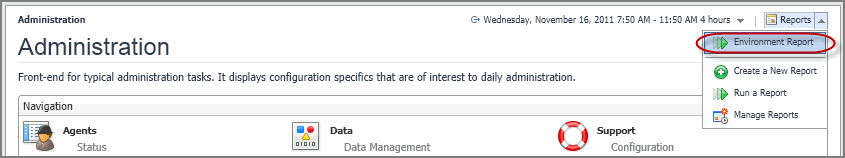
Some Foglight dashboards have reports associated with them. This allows you to run a report based on the current dashboard. You can generate the report using the Reports menu in the top-right corner.
The Administration home page is associated with the Environment Report. Run this report by choosing Environment Report from the Reports menu, and specifying the input parameters in the report wizard.
The report wizard provides more information about the Environment Report and instructions on how to set the input values. For more information about reports in Foglight, see the Foglight User Help.
|
1 |
|
3 |
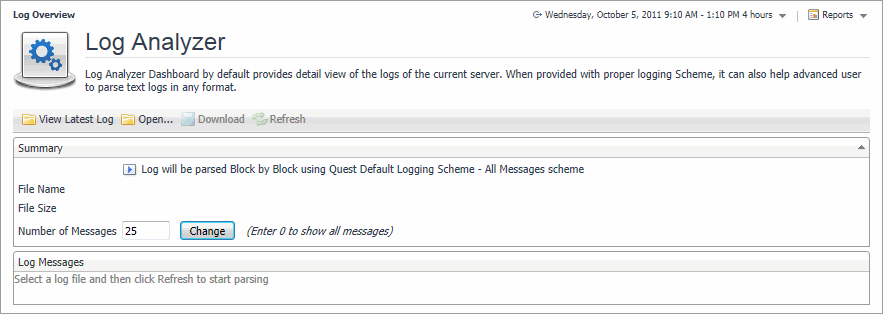
To download the selected log file, click Download and save the file to a desired location. |