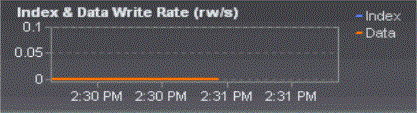
The Index & Data Write Rate graph depicts rates for retrieving index and data pages from the buffer pools for the application over consecutive monitoring intervals and writing them to the database. These rates are based on the number of pages written per second. The graph contains the following series:
Data —Plots the rate at which data pages are written from the buffer pools to the database.
Index —Plots the rate at which index pages are written from the buffer pools to the database.
The Statistics tab shows the buffer pool read and write counts used to generate this graph. The names for these statistics begin with Buffer Pool. These statistics are derived from the POOL data elements that the DB2 snapshot monitor captures.
