On grids with the Select All and Clear All buttons you can select multiple rows in the grid.
| Click | To do this... |
|---|---|
 |
Select all rows |
 |
Clear all rows |
| CTRL + click | Select several individual rows (or clear rows already selected) |
| SHIFT + click | Select a range of rows |
To freeze the first column
When selected the first column will remain visible while you scroll through the columns of the table:
Right-click the grid header and select Freeze First column.
To word-wrap text
By default, Spotlight truncates text that is too long to fit in the space allocated to the column. To allow text to wrap onto multiple lines:
Spotlight Basics describes how Spotlight applications work. It contains these sections:
| Section |
Description |
|---|---|
| Spotlight Connections |
Create / Modify / Delete connections to systems, and monitor those systems. |
| Monitor Spotlight Connections | Monitor connections, detect alarms, investigate the cause of alarms. |
| Alarms |
Alarms are the warnings that Spotlight raises when a metric falls outside its "normal" range of values. |
| Charts, Grids and Home Page Components | Spotlight displays provide detailed statistics of the monitored system, relevant to diagnosing the cause of alarms. Make the best use of them. |
| View | Options | Customize Spotlight. |
| Troubleshooting | Solve problems using Spotlight. |
The components in the Spotlight home page are visual objects that correspond to important features of the system Spotlight is monitoring. Components can be of many different types, including buttons, gauges, data flows, queues, spinners, and containers.
Note: They change color to alert you to performance bottlenecks. Spotlight Alarms
| Component |
Description |
Component | Description |
|---|---|---|---|
 |
Button - Sometimes called a process icon. A Spotlight component that contains a single value that represents the state or existence of a process. |
 |
Data flow - Panels in the Spotlight home page may be connected to other panels by data flows that show the rate at which data is moving through a system. As the rate increases, so does the speed of the flow. |
 |
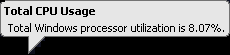
Gage - A Spotlight component that shows a measurement as a continuous range of possible values. |
 |
Queue - Spotlight component that shows a measurement as a range of discrete values. The globe at the end of the queue is an alarm indicator. |
 |
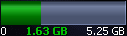
Container - A cylindrical component that fills up as the value it measures increases. Normally used to indicate file size or disk usage. |
 |
Spinner - Spotlight component that shows a measurement as a rotating wheel. The higher the value, the faster the speed of rotation. |
| Action | Description |
|---|---|
| Hover the mouse over the component |
Opens information on the status of the component.
|
|
Click on the component. |
Shows What's this help or performs other customized action. Balloon help |
| Right click on the component | What's this |
Opens information about the component in balloon help. If an alarm is raised on the component, then opens help for resolving the alarm. Spotlight Alarms |
| Right click on the component | Show History |
View the recent history of the component. Tips:
|
| Right click on the component | Show Details | View a drilldown page for the component. Spotlight drilldown pages contain a detailed breakdown of the statistics used to diagnose the component. |
| Right click on the component | Snooze alarm |
Ignore (Snooze) Alarms Components with snoozed alarms are represented by |
| Right click on the component | Copy to Clipboard | Copy To Clipboard |
| Right click on the component | Restore Default Settings | You can change the appearance and behavior of Spotlight components. Restore Default Settings |
| Right click on the component | Metrics | |
| Right click on the component | Properties | |
Click  . . |
This icon indicates the diagnostic server is unable to collect the data required for the affected component. Click the icon for more information. |
 |
Data for this control is not available. (There are no alarms associated with this control.) Component Properties - Overhead Page |
 |
Data for this control is not available. (Alarms associated with the control are disabled.) Component Properties - Overhead Page |

 .
.