Calibrate the Spotlight home page components to display data in the way best suited to the monitored system.
Note: Spotlight automatically calibrates new connections the first time that they are opened. Use this dialog to re-calibrate a connection at any other time.
Scenario: Calibration of data flows
Data flows on the Spotlight home page indicate the rate at which data is being transferred through a system. The faster the rate of traffic, the faster the data flow moves. However, the data flow is an accurate representation of system activity ONLY if Spotlight knows the normal range of values for your system.
If the normal range of values for a data flow is from 0 to 100, a value of 8 is low, and the data flow moves slowly.
If the range of values for your system is from 0 to 10, a value of 8 is high and the data flow moves much faster.
The Spotlight calibration tool calculates the normal range of metric values for your system. Over a set period of time, Spotlight measures the changes in value of important metrics within the system. It uses this data to set the upper and lower display limits for the corresponding components. You can accept the results or adjust them if necessary.
To re-calibrate a connection
Notes:
Spotlight Basics describes how Spotlight applications work. It contains these sections:
| Section |
Description |
|---|---|
| Spotlight Connections |
Create / Modify / Delete connections to systems, and monitor those systems. |
| Monitor Spotlight Connections | Monitor connections, detect alarms, investigate the cause of alarms. |
| Alarms |
Alarms are the warnings that Spotlight raises when a metric falls outside its "normal" range of values. |
| Charts, Grids and Home Page Components | Spotlight displays provide detailed statistics of the monitored system, relevant to diagnosing the cause of alarms. Make the best use of them. |
| View | Options | Customize Spotlight. |
| Troubleshooting | Solve problems using Spotlight. |
Alarms are the warnings that Spotlight raises when a metric falls outside its "normal" range of values. A new alarm is raised whenever the severity for a metric changes. When the severity returns to normal, the alarm is canceled.
Alarms are recorded in the Spotlight alarm log pages:
Many Spotlight elements use color to indicate severity.
High
Medium
Low
Normal
Information
Disabled
You can configure Spotlight to notify you of changes to severity through color or intensity, audible warnings, sending email or network notifications or running a program.
| Spotlight elements whose color represents severity | Color indicates | What to do |
|---|---|---|
|
The open/close button on the Spotlight browser
The system tray icon
|
The highest severity currently raised - across all Live (monitored) connections. | Locate the connection in the Spotlight Browser (Live connections). Open the connection's Home Page, Alarm Log or Alarms by Time. |
|
The connection name in the Spotlight browser (Live connections) and connection status bar
|
The highest severity currently raised against the connection. |
Locate the connection in the Spotlight Browser (Live connections). Open the connection's Home Page, Alarm Log or Alarms by Time. |
| The component on the Spotlight home page | The highest severity currently raised against the component. |
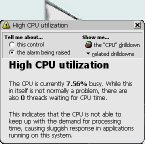
Click on the component to open help regarding the alarm. The text in the help window gives some details about the alarm, why it was raised, and ways in which the problem indicated can be resolved.
Use the help to open the drilldown page that is directly related to the alarm. Drilldown pages contain charts and tables that you can use to diagnose the cause of the alarm.
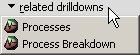
You may like to view one or more related drilldown pages that may be of some value in diagnosing the problem.
Use the information shown in the help window, together with the details shown in the associated drilldown page(s), to discover why Spotlight has raised the alarm. If the alarm is transient, you at least will see where in the system it occurred. If the alarm persists, Spotlight indicates what measures need to be taken to resolve the problem. Note: These actions are customizable. Balloon help |
| The entry in the alarm log page |
The severity of the alarm. |
Alarms are recorded in the Spotlight alarm log pages:
|
Historical alarms
For an alarm raised in the past, view a snapshot of the system as a whole at the time the alarm was raised.
Customize the way that Spotlight handles alarms:
| Option | Description |
|---|---|
| Set new thresholds | You can edit the metric and measures by which an alarm is raised in the Metrics Editor. About Alarms, Metrics, Thresholds And Severities |
| Set action rules |
Govern Spotlight behavior when an alarm is raised. Alarm actions |
| Set filters |
Govern which alarms are displayed. Alarm Filters |
| Ignore specific alarms |
Spotlight Today shows recent alarms for all Spotlight connections. Spotlight Today can be grouped or filtered to show alarms by connection or severity. Spotlight Today displays: the number of current Spotlight connections, the number of connections for which an alarm has been raised, a Spotlight Today entry for each alarm raised.
To see Spotlight Today
| Toolbar | Menu | Shortcut |
|---|---|---|
Click  |
Click View | Spotlight Today. |
N/A |
About the Spotlight Today grid
| Column | Description |
|---|---|
|
Severity |
The degree of urgency of the alarm. |
| Alarm |
The name of the alarm. Note: This column is unavailable on Group By | Alarm. |
|
Connection |
The name of the Spotlight connection that raised the alarm. Note: This column is unavailable on Group By | Connection. |
|
Raised |
The time the alarm was raised. |
| Message | More information on the alarm. |
|
Connection type |
The type of Spotlight connection that raised the alarm (for example, Spotlight on Oracle). |
|
Last updated |
The last time the alarm was updated. |
| Occurrences |
How often the alarm has occurred in the monitoring period. |
Actions on Spotlight Today
| Click | Description |
|---|---|
 |
Find Text |
 |
Alarm Filters - Filter by severity and connection. Show snoozed alarms. |
 |
Save To File |
 |
Copy To Clipboard |
 |
Show, Hide & Order Columns - Some of the columns in the grid may be hidden by default. Use the Column Organizer to select the columns you want to see. |
 |
Alarm actions - Define actions to perform when an alarm meets pre-defined conditions. |
| Right click the header row and select Arrange by | Column name | Sort the Grid - Sort the grid according to the contents of a column |
| Right click the header row and select Freeze First column | Grid Properties - Options Page - Keep the first column visible while you scroll through the columns of the table. |
| Right click the content and select Group By |
Group By | Connection - Arrange the grid in a tree like structure by connection. Group By | Alarm - Arrange the grid in a tree like structure by alarm. Group By | Do Not Group - List the alarms. |
| Right click the grid content and select Collapse or Expand. |
Collapse / Expand the tree structure. Applicable on Group By | Connection and Group By | Alarm. |
| Right click an alarm and select Open Connection | Open the Spotlight Home Page for the selected connection. |
| Right click an alarm and select Properties | Open the Connection Properties dialog for the selected connection. Connection Properties - Details Page |