Note: Available for Oracle 10.2 and later.
Use this page to predict what resources (CPU, memory, and disk) are required by a hypothetical increase in database throughput and database concurrency.
Specifically, you can use it to perform these tasks:
To open this page
Click Predictive Diagnostics | What Database Resources Are Needed?.

Set the parameters for predicting what resources are needed
|
Control |
Description |
|---|---|
|
Perform an analysis of... |
Select Real Data (your database) or Sample Data (to experiment with). Note: Spotlight takes some time (typically about 10 days) to collect enough data to make valid predictions on the future performance of your Oracle instance. In the meantime use the prepared sample data to learn more about Predictive Diagnostics and how it works. |
|
Within the processing period... |
Select an activity period to use for your prediction. The more selective this is the better the prediction. Tip: To define new processing periods or redefine an existing processing period see Peak Processing Periods. |
|
For all collected data or For data collected since... |
Click all or the date to open Performance Modeling Oracle Job. If you select a start date in Data Analysis Options then this text reads For data collected since.... Note: The start date should be a date for which recorded data exists. For example, you cannot select a date later than today's date. Use this setting to ignore data that occurred before a specific time. |
| Analyze Disk I/O for. |
The Predictive Diagnostics metric for disk utilization can be either disk latency or disk throughput (Disk Latency And Disk Throughput). Select the one that best suits your environment. |
|
Predict forward until... |
Select an end date for the prediction. |
Once you have set the parameters for the analysis, use the hypothetical load prediction to view how your current setup would cope with a change in the amount of data processed by the database (throughput) and the number of users connected to it (concurrency). To do this:
|
A. |
Under Predict resource requirements... select hypothetical database load. |
|
B. |
Choose how you want to predict the hypothetical load. Select one of these options and enter the required data for:
|
|
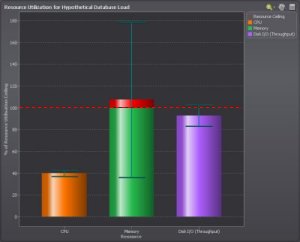
C. |
Wait for Spotlight to model the effect of the hypothetical load on database resources. The result is shown in the bar chart Resource Utilization for Hypothetical Database Load.
|
|
D. |
Click Show Database Throughput and Concurrency by Time to open a sub-page where you can view the expected database load over time. Use this sub-page to chart the effect of a hypothetical increase in database load when you do not know the size of the increased load. (What would happen, for example, if the database throughput increased by 50%?) Note: The two charts in this sub-page are the same as the equivalent charts in the Why Will Database Resources Reach Their Ceiling? | Database Throughput And Concurrency page. |
Once you have set the parameters for the analysis, use the Expected database load prediction to view a prediction of how your current setup will cope with the expected database load at a set date in the future. To do this:
|
A. |
Under Predict resource requirements... select Expected database load. |
|
B. |
Choose the date for which you want to view the expected database load. How far into the future? The further you look into the future, the less accurate the prediction will be. Its accuracy depends on the time spanned by the existing raw data, NOT on the time-span displayed in the chart. |
|
C. |
Wait for Spotlight to model the effect of the expected load. The result is shown in the bar chart Resource Utilization by Time.
|
|
D. |
Click Show Database Throughput and Concurrency by Time to open a sub-page where you can view the expected database load over time. Use this sub-page to chart the effect of a hypothetical increase in database load when you do not know the size of the increased load. (What would happen, for example, if the database throughput increased by 50%?) Note: The two charts in this sub-page are the same as the equivalent charts in the Why Will Database Resources Reach Their Ceiling? | Database Throughput And Concurrency page. |
|
A. |
Under Predict resource requirements... select BOTH hypothetical database load AND Expected database load. |
|
B. |
Select one of these options for the hypothetical database load and enter the required data for:
AND choose the date for which you want to view the expected database load. |
|
C. |
Click Show Database Throughput and Concurrency by Time to open a sub-page where you can view the expected database load over time. Note: The two charts in this sub-page are the same as the equivalent charts in the Why Will Database Resources Reach Their Ceiling? | Database Throughput And Concurrency page. |
Predictive Diagnostics generates a separate Resource Utilization summary for each option (hypothetical database load or expected database load, or a combination of both) under Predict resource requirements...
Until you click Show Database Throughput and Concurrency by Time, the page displays only the top summary, whose contents relate to the option under Predict resource requirements... It shows:
When you click Show Database Throughput and Concurrency by Time, the bottom summary displayed is the same as that shown in the Why Will Database Resources Reach Their Ceiling? | Database Throughput And Concurrency page.
Notes: