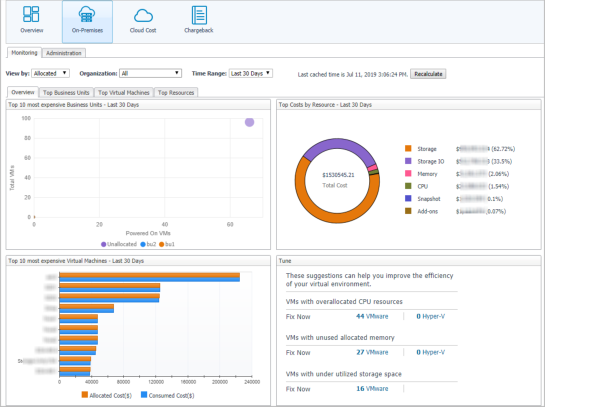
The On-Premises dashboard displays the statistic total cost of organizations, business units, and virtual machines in the last 7/30/90 days. Metrics and charts in this tab will be updated every day or you could click the Recalculate button to manually update all charts. To access this dashboard, under Homes, click Cost Director.
This dashboard consists of the following two tabs:
|
• |
View by: Calculate the resource costs based on Allocated costs or Consumed costs. Allocated is selected by default. |
|
• |
Time Range: Provides three time period of metrics calculation. Last 30 Days is selected by default. |
|
• |
The On-Premises charts, which appears on the On-Premises dashboard by default after you click Cost Director > On-Premises. |
The On-Premises charts appear on the On-Premises dashboard by default after you click Cost Director > On-Premises, which includes the following four tabs:
|
NOTE: The Top Business Units, Top Virtual Machines, and Top Resources tabs are not available on the Lite version. |
|
• |
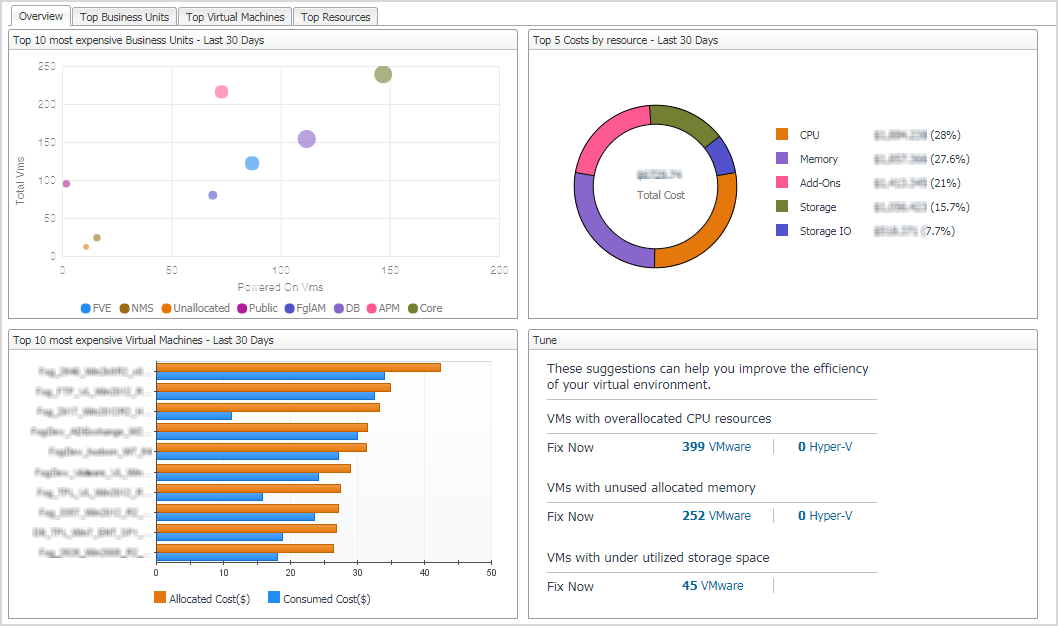
Overview: Shows top 10 most expensive Business Units - Last N Days, Top 5 Costs by resource - Last N Days, Top 10 most expensive Virtual Machines - Last N Days, and Tuning information. |
|
• |
Top Business Units: Shows the detailed information of the Business Unit that allocates or consumes the most costs. |
|
• |
Top Virtual Machines: Shows the detailed information of the Virtual Machines that allocates or consumes the most costs. |
|
• |
Top Resources: Shows the detailed information of the Resource that allocates or consumes the most costs. |
The Administration dashboard appears after clicking Cost Director > On-Premises > Administration, which sets up and changes the configurations of:
|
• |
Organizations: Lists the available organizations and provides you with the options to add, delete, and edit the selected organizations. |
|
• |
Business Units: Lists the available business units, provides you with the options to add, delete, and edit the selected business units, and allows you to assign an organization or price plan for the selected business unit. |
|
• |
Virtual Machines: Lists the available virtual machines, provides you with the options to add, delete, and edit the selected business units, and allows you to assign a business unit or price plan for the selected virtual machine. |
|
• |
Compute Price Plans: Lists the available price plans of compute resources and provides you with the options to |
|
• |
Storage: Lists VMware datastore items and assigns the existing storage plan for the selected range. |
|
• |
Storage Price Plans: Lists the available price plans of storage and provides you with the options to |
|
NOTE: In the Add new price plan and the Edit Price Plan dialog box, click the Load System Compute Price Plan button or the Reset to Load System Compute Price Plan button to load system default price plan.
NOTE: After setting the currency in the Currency Configuration dialog box, all the currency units displayed in the dashboard will be updated. You can also set Exchange Rate to USD on this page.
|
|
• |
Topology: The Topology tab visualizes the relationships between the objects in your environment through an interactive dependency map. The map illustrates how different components relate to each other, and the levels of the available resources available to them. The Topology tab provides a quick and easy way to view components grouped by organization. |
|
• |
VM Ownership: The VM Ownership tab enables user to assign datacenters, clusters, resource pools, and vfolders to different Business Units. |