Use Foglight for SNMP to collect data from all types of devices, such as desktops, servers, routers, and switches, across Microsoft®Windows®, Linux®, Oracle Solaris®, HP-UX™, and AIX® operating systems. When you enable SNMP on a device and provide the correct credentials, Foglight for SNMP can monitor that device and collect data from it.
Starting with version 5.8.5.3, the SNMP agent package that collects data is no longer deployed during installation. Using multiple Foglight Agent Managers is now supported, so after you install the Foglight for SNMP cartridge on the Management Server, run an SNMP discovery to select an Agent Manager. For more information, see Running SNMP discovery.
Foglight for Infrastructure must be installed before installing Foglight for SNMP. For more information, see the Foglight for Infrastructure Release Notes.
For information about installing or upgrading Foglight for SNMP, and for system requirements and compatibility, see the Foglight for SNMP Release Notes.
For general cartridge installation instructions, see the “Install Foglight cartridges” topic in the Foglight Administration and Configuration Guide.
|
2 |
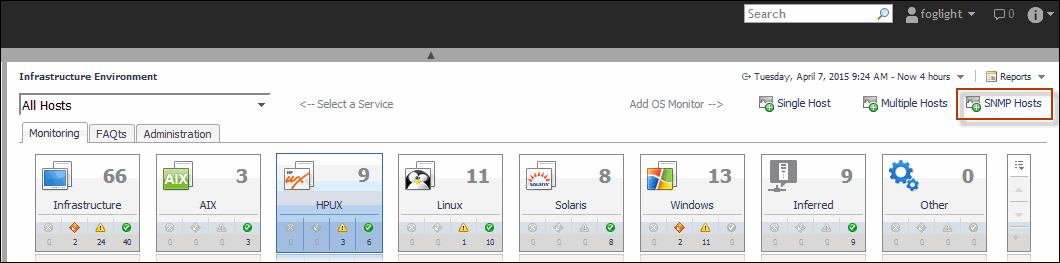
In the navigation panel, under Dashboards, click Infrastructure. |
The SNMP Hosts button is in the top-right corner of the Infrastructure Environment dashboard.
For information on how to discover network devices using the SNMP Hosts button, see Running SNMP discovery.

|
1 |
On the navigation panel, under Dashboards, click Infrastructure. |
For information about the host details on the Infrastructure dashboard, see Hosts monitored by both an Infrastructure and SNMP agent.
Foglight for SNMP 5.8.5.5 has changed the way it alerts users about host availability.
|
• |
MONITORED. This is the default state. It is set on the Host object when the host can be reached via SNMP. |
|
• |
UNMONITORED. It is set on the Host object when the target host cannot be reached via SNMP, but can be reached via ICMP. |
|
• |
UNAVAILABLE. It is set on the Host object when the target host cannot be reached via both SNMP and ICMP. |
When the Host monitored status changes, the following alarms are triggered: Warning (for the UNMONITORED state) and Critical (for the UNAVAILABLE state).
If a host is monitored by both the Infrastructure and the SNMP agent, then the host monitored status is identified and reported as described in the Foglight for Infrastructure User and Reference Guide, “Host availability alerting” section.
