Resource Utilizations view
Use this view to review the levels of CPU, network, memory, and disk utilization and overall consumption, broken into four simple views. Foglight™ for vCloud Director populates these values using the metrics collected by Foglight for VMware. For more information about the metrics appearing in these views, see the Managing Virtualized Environments User and Reference Guide.
Reviewing Frequently Asked Questions
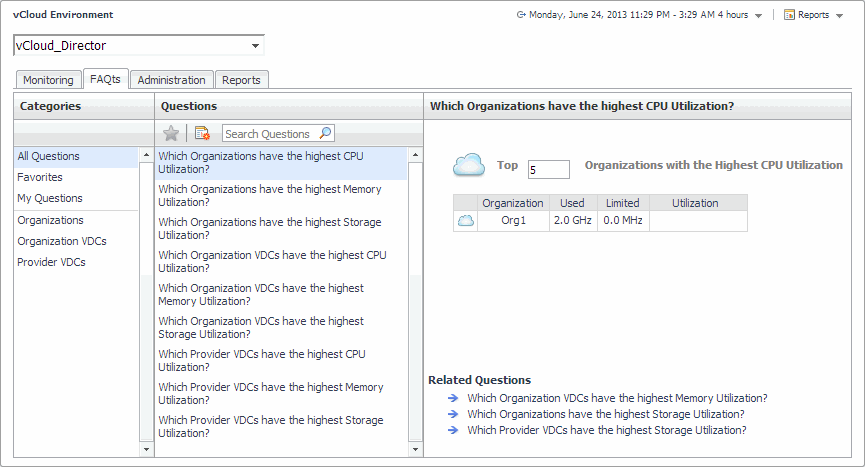
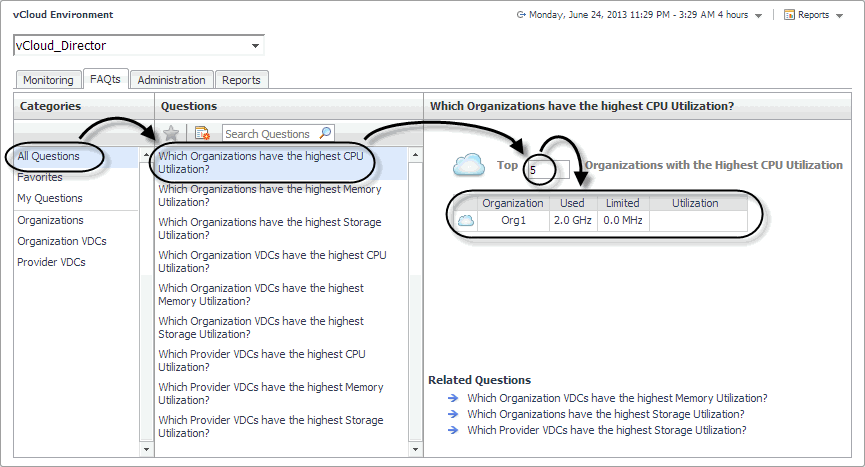
Foglight™ for vCloud Director offers a collection of frequently asked questions that provide quick insight into resource utilization levels for organization and provider vDCs in your monitored system. The question mechanism is interactive, guiding you to choose a category and specify additional parameters.
You can find the available questions on the FAQts tab of the vCloud Monitoring dashboard.
On this tab, the Categories pane several question groups. Selecting a category shows the questions belonging to that category in the Questions pane. From there, clicking a question shows the answer on the right.
Generating Reports
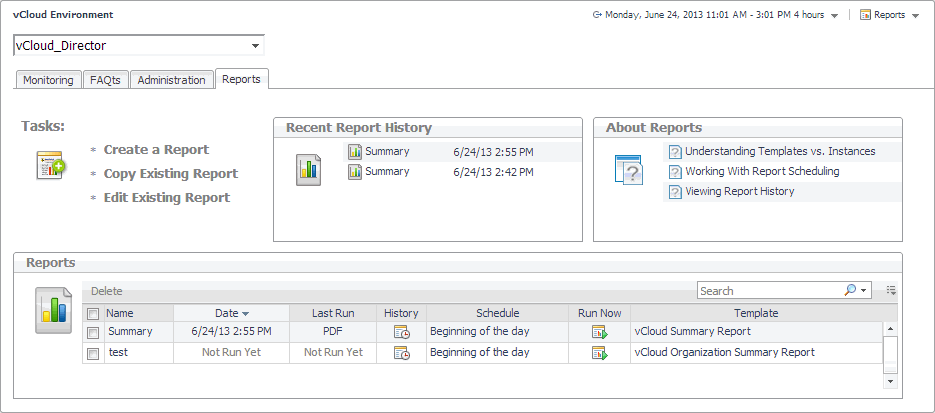
Foglight™ for vCloud Director includes a report generation ability. This allows you to create reports using a set of predefined templates to report on the various aspects of your virtual environment. Foglight for VMware includes a collection of predefined report templates.
You can generate, copy, and edit reports using the Reports tab on the vCloud Environment dashboard, or alternatively the Reports dashboard included with the Management Server.
For more information on how to use this tab to create and manage reports, see the Managing Capacity in Virtual Environments User Guide. For complete information about the Reports dashboard, see the Foglight User Help.
The following templates are available with Foglight for VMware.
|
Compile a list of vCloud Director® provider and organization vDCs. For each provider and organization vDC, the list indicates if the vDC is enabled and its alarm state, the levels of used, allocated, and limited CPU, memory, and storage resources, along with a health history bar. In addition, the report shows the allocation model associated with each organization vDC. | |
Investigating Object Dependencies
A typical vCloud Director® environment consists of many interrelated components. Understanding the dependencies between logical and virtual components in your monitored environment, and the levels of resources they consume, allows you to better understand resource-related issues, potentially affecting the stability of your system. This can help you predict the impact a potential outage may have on your environment, and to prevent such events, by reallocating resources where they are most needed.


