サポートと今すぐチャット
サポートとのチャット

Foglight for Infrastructure 5.9.4 - User Guide

Using Foglight for Infrastructure Monitoring log files with Foglight Log Monitor Monitoring IBM PowerVM environments
Before you begin Managing PowerVM HMC agents Monitoring your PowerVM environment
Advanced system configuration and troubleshooting Reference
Foglight for Infrastructure views Foglight Log Monitor views Rules Metrics
Appendix: Building regular expressions in Foglight

Exploring PowerVM VIOS network summaries

The Summary tab on the Network tab of the PowerVM VIOS detail view provides information all network adapters associated with the selected PowerVM® VIOS, shared ethernet adapters, virtual ethernet adapters, and physical ethernet adapters. Use it to find out if any specific collection of adapters exhibits low throughput, high levels of dropped packets or errors, to maintain the stability of your system and ensure optimum network throughput levels.

To navigate to this tab, in the Selected Service PowerVM view, select a PowerVM VIOS, and click Explore. Open the Network tab, and open the Summary tab.

Figure 34. Summary tab

Table 16. Summary view

Displays information about all network adapters associated with the selected PowerVM VIOS.

Displays information about shared network adapters associated with the selected PowerVM VIOS.

Displays information about virtual network adapters associated with the selected PowerVM VIOS.

Displays information about physical network adapters associated with the selected PowerVM VIOS.

Send

The current rate at which monitored network adapters send data to the network.

Receive

The current rate at which monitored network adapters receive data from the network.

Send Rate

The average rate at which monitored network adapters send data to the network during the selected time range.

Receive Rate

The average rate at which monitored network adapters receive data from the network during the selected time range.

Send

The current rate at which monitored network adapters encounter errors while sending data to the network.

Receive

The current rate at which monitored network adapters encounter errors while receiving data from the network.

Send Error

The average rate at which monitored network adapters encounter errors while sending data to the network during the selected time range.

Receive Error

The average rate at which monitored network adapters encounter errors while receiving data from the network during the selected time range.

Inbound

The current rate at which monitored network adapters drop data packets while sending data to the network. By default, network adapters send or receive multiple data packets in a single request. When data packets are dropped before reaching their destinations, this may indicate a problem with the network connection or the network adapters.

Outbound

The current rate at which monitored network adapters drop data packets while receiving data from the network.

Inbound Packets

The average rate at which monitored network adapters drop data packets while sending data to the network during the selected time range.

Outbound Packets

The average rate at which monitored network adapters drop data packets while receiving data from the network during the selected time range.

Drilling down on shared network adapters

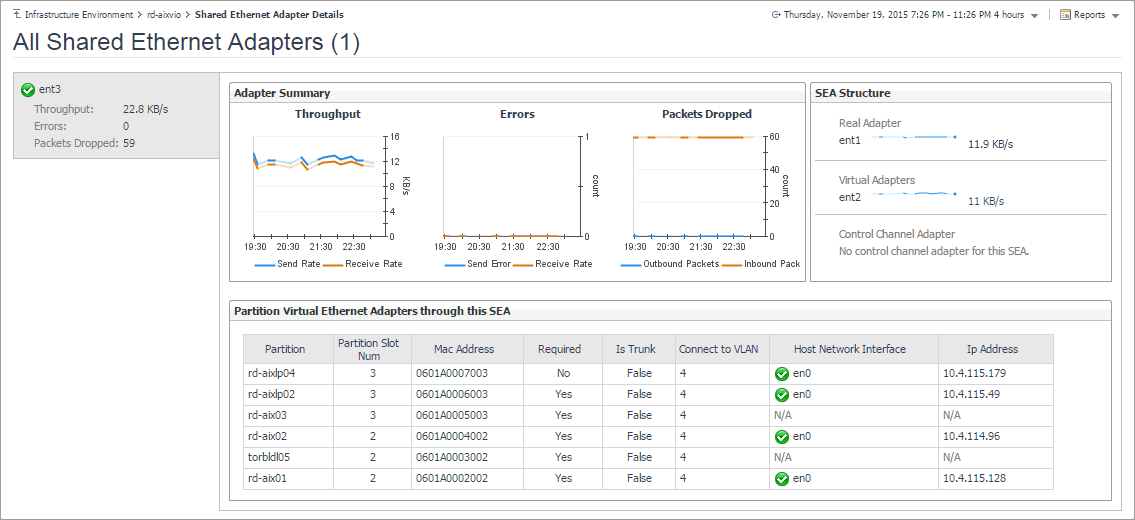
The Shared Ethernet Adapter Details view provides information about all shared network adapters associated with the selected PowerVM® VIOS. A shared network adapter enables multiple PowerVM partitions to share one adapter, to optimize the overall use of physical resources. Use it to find out if the adapters exhibits low throughput, high levels of dropped packets or errors, to maintain the stability of your system and ensure optimum network throughput levels. You can also use this view to review the PowerVM partitions that use these adapters, and to review their settings.

To navigate to this view, in the Selected Service PowerVM, select a PowerVM VIOS, and click Explore. Open the Network tab, click Summary, and in the Shared Ethernet Adapters Summary area, click View SEA Details.

Send

The average rate at which shared network adapters send data to the network during the selected time range.

Receive

The average rate at which shared network adapters receive data from the network during the selected time range.


Send Error

The average rate at which shared network encounter errors while sending data to the network during the selected time range.

Receive Error

The average rate at which shared network adapters encounter errors while receiving data from the network during the selected time range.

Inbound Packets

The average rate at which shared network adapters drop data packets while sending data to the network during the selected time range. By default, network adapters send or receive multiple data packets in a single request. When data packets are dropped before reaching their destinations, this may indicate a problem with the network connection or the network adapters.

Outbound Packets

The average rate at which shared network adapters drop data packets while receiving data from the network during the selected time range.


Real Adapter

Virtual Adapter

Channel Control Adapter

A sparkline indicating the rate at which physical, virtual, Ether Channel, or control channel network adapters send and receive data from the network


Partition

The PowerVM partition using this network adapter.


Partition Slot Num

The slot number associated with the PowerVM partition.


Mac Address

The MAC address of the PowerVM partition.


Required

Indicates whether the I/O slot or virtual I/O adapter is required for the partition. Valid values:

0: Required
1: Not required


Is Trunk

Indicates whether the virtual Ethernet adapter is the trunk or uplink adapter for the virtual LAN. Valid values:

0: Yes
1: No


Connect to VLAN

The virtual LAN ID.


Host Network Interface

The physical network adapter associated with the PowerVM partition.


Ip Address

The IP address of the PowerVM partition.

Drilling down on physical and virtual network adapters

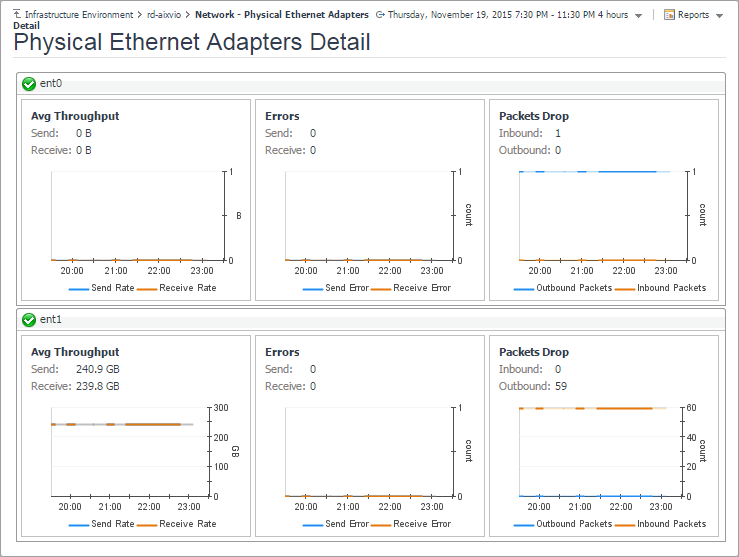
The Network - Virtual Ethernet Adapters Detail and Network - Physical Ethernet Adapters Detail views provide information about physical and virtual network adapters associated with the selected PowerVM® VIOS. Use it to find out if the adapters exhibits low throughput, high levels of dropped packets or errors, to maintain the stability of your system and ensure optimum network throughput levels.

To navigate to these views, in the Selected Service PowerVM view, select a PowerVM VIOS, and click Explore. Open the Network tab, and then open the Summary tab. In the Virtual Ethernet Adapters Summary area, click View VEA Details, to see the Network - Virtual Ethernet Adapters Detail view. To access the Network - Physical Ethernet Adapters Detail view, in the Physical Ethernet Adapters Summary area, click View PEA Details.

Send

The current rate at which virtual network adapters encounter errors while sending data to the network.

Receive

The current rate at which virtual network adapters encounter errors while receiving data from the network.

Send Rate

The average rate at which virtual network adapters encounter errors while sending data to the network during the selected time range.

Receive Rate

The average rate at which virtual network adapters encounter errors while receiving data from the network during the selected time range.

Send

The current rate at which virtual network adapters encounter errors while sending data to the network.

Receive

The current rate at which virtual network adapters encounter errors while receiving data from the network.

Send Error

The average rate at which virtual network adapters encounter errors while sending data to the network during the selected time range.

Receive Error

The average rate at which virtual network adapters encounter errors while receiving data from the network during the selected time range.

Inbound

The current rate at which virtual network adapters drop data packets while sending data to the network. By default, network adapters send or receive multiple data packets in a single request. When data packets are dropped before reaching their destinations, this may indicate a problem with the network connection or the network adapters.

Outbound

The current rate at which virtual network adapters drop data packets while receiving data from the network.

Inbound Packets

The average rate at which virtual network adapters drop data packets while sending data to the network during the selected time range.

Outbound Packets

The average rate at which virtual network adapters drop data packets while receiving data from the network during the selected time range.

Investigating object dependencies

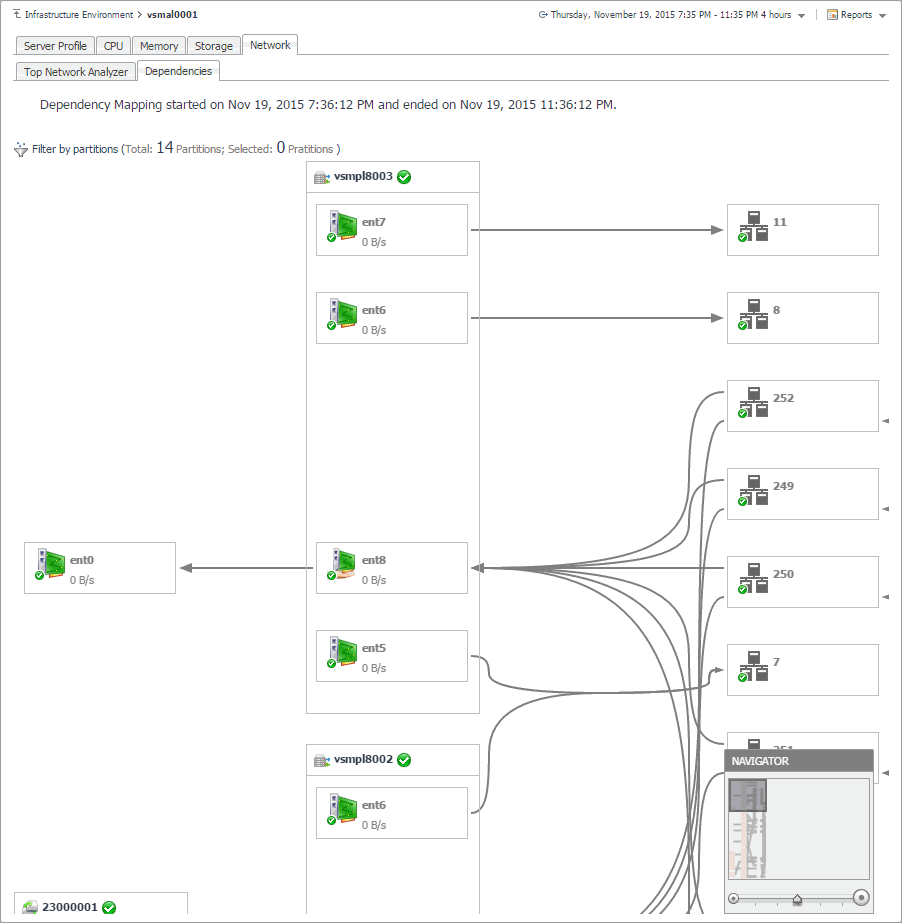
Dependency views visualize the relationships between the selected memory, disk, and network elements and other objects in your integrated environment, through an interactive map. Use these view to better understand resource-related dependencies, to predict the impact a potential outage may have on your environment, and to prevent such events, by reallocating resources where they are most needed.

To navigate to dependency views, in the Selected Service PowerVM view, select a PowerVM® partition, managed server, or PowerVM VIOS, and click Explore. Open the Memory tab (managed servers only), Storage tab, or Network tab, and then open the Dependencies tab.

Figure 37. Dependency tab

A typical PowerVM environment consists of many interrelated components. Understanding the dependencies between logical and virtual components in your monitored environment and the levels of resources they consume allows you to project possible performance bottlenecks that can affect the stability of your system. This can help you predict the impact a potential outage may have on your environment, and to prevent such events, by reallocating resources where they are most needed.

The Dependencies dashboard visualizes the relationships between the objects in your environment through an interactive map. The map illustrates how different components relate to each other, and the levels of the available resources available to them.

1
On the Infrastructure Environment dashboard, on the Monitoring tab, select a managed server, partition, or VIOS, and click Explore.
2
On the Detail view appearing in the display area, open the Storage or Network tab, and click Dependency.
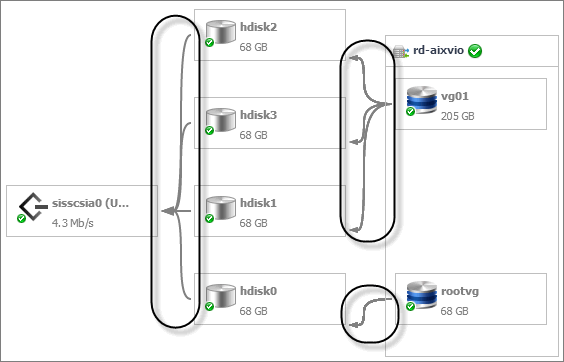
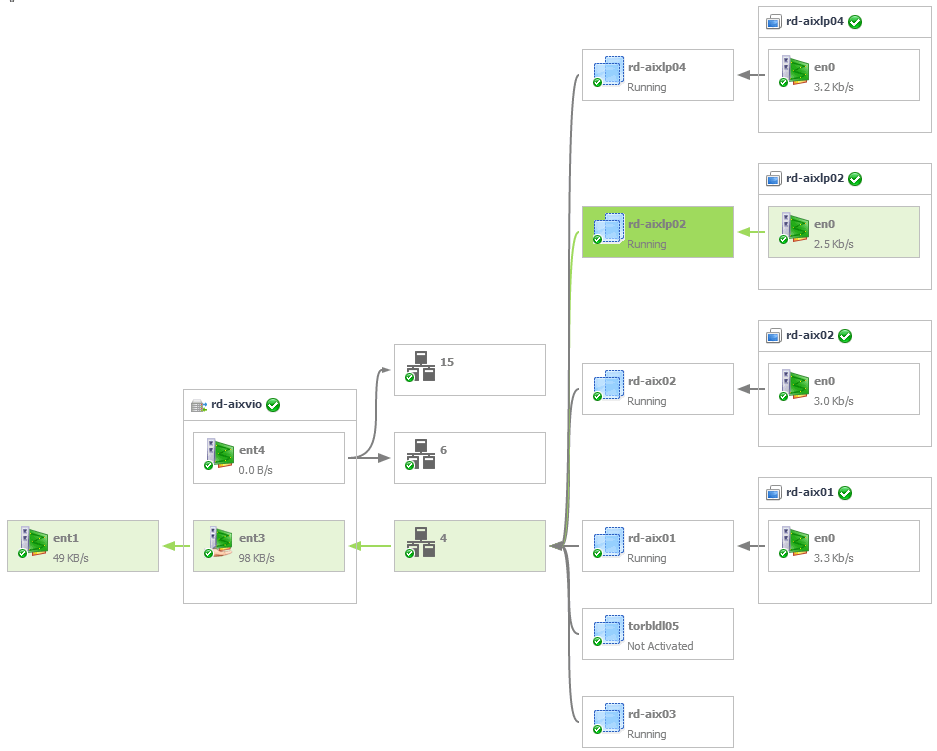
Figure 39. Dependency map

The complexity of the information appearing in a dependency map depends on the selected object and the dependencies that object has with other objects within your integrated infrastructure.

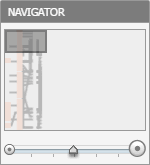
In a large multi-component environment, dependency maps are likely complex and may not fit your screen. The NAVIGATOR in the top-right corner allows you to easily set the zoom level by dragging the slider into a desired position.

Figure 40. NAVIGATOR

In a dependency map, some objects are represented with container tiles, others with single-object tiles or just icons. Every object is represented with an icon, representing its type. This allows you to quickly identify the elements of a dependency map.

Partition

VIOS

Host

Host’s disk

Disk pool

Physical disk

Network adapter

SCSI adapter

VLAN


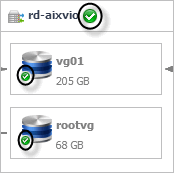
Every object appearing in the map includes an indicator of its health.

Figure 41. Health indicator

Dependencies between the objects in a map are illustrated with single-directional arrows.

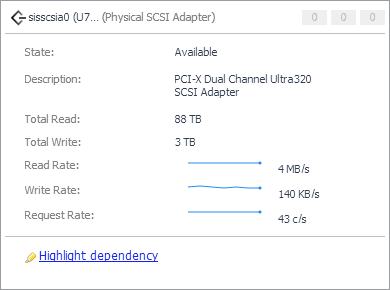
To find out more about an object appearing in the dependency map, click the object icon. A dwell appears, displaying more details about that object. The type and range of information appearing in the dialog box depends on the selected object’s type. For example, drilling down on a SCSI Adapter shows the counts of alarms generated against the selected adapter in each severity state, the adapter's state and description, and displays information about the data traffic processed by the adapter.

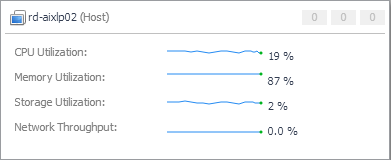
However, if you drill down on a host object the resulting dialog box displays the counts of alarms generated against the selected host in each severity state, and the levels of processor, memory, network, and datastore resources the currently host uses.

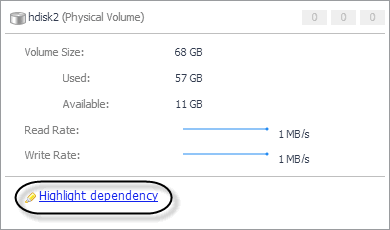
Certain object types allows you to trace down the dependencies an object has with multiple map elements. Use this feature if you want to find out which elements are associated with a particular object whose performance you want to investigate. To do that, click the object on the map, and in the dwell that appears, click Highlight dependency.

This causes all of the related objects and dependencies to appear highlighted in the map.

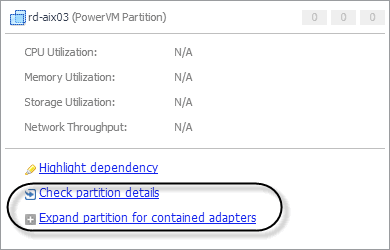
In addition to Highlight dependency, some object types offer other options when selected. For example, when you click a partition, you can click Check partition details to drill down on the partition, or Expand partition or Collapse partition for contained adapters to show or hide the network adapters the selected partition uses.

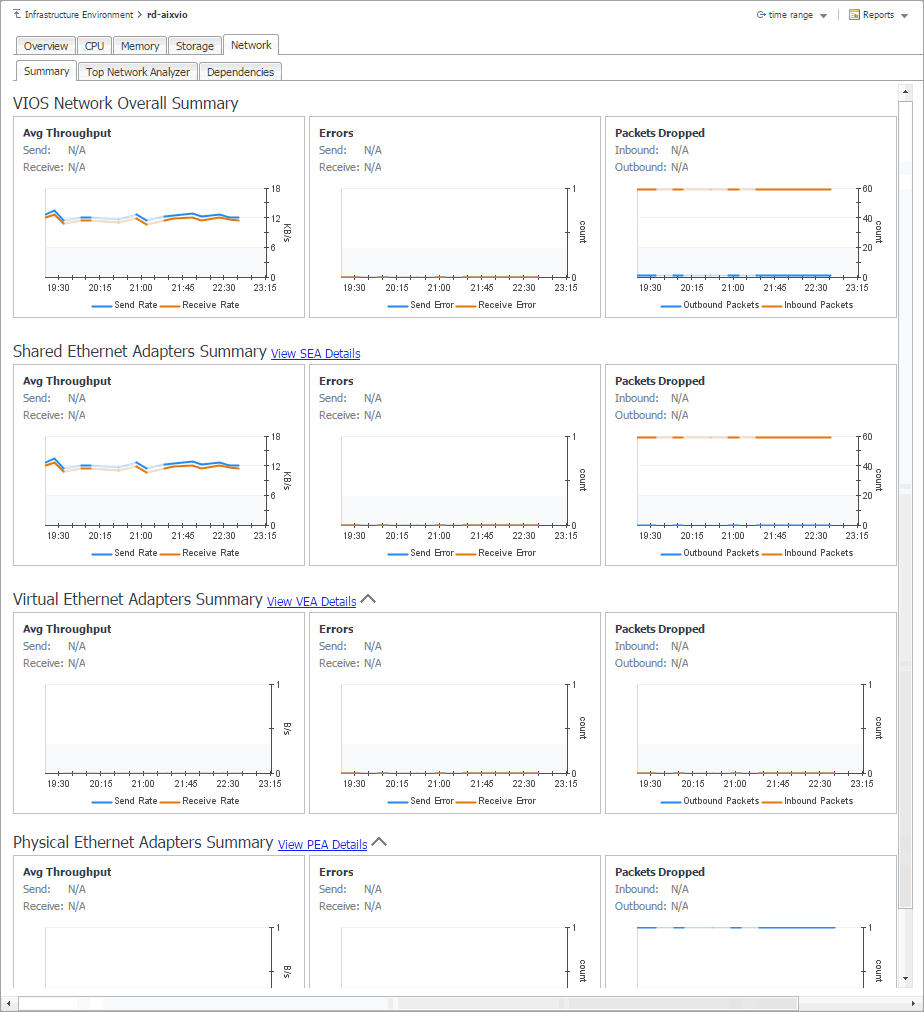
Figure 47. Check partition details and Expand partition links

When you drill down on a managed server or a VIOS, their dependency maps allow you to filter the map by a partition. Doing so allows you to display only those elements associated with one or more desired partitions. This can help you to isolate specific objects in your integrated environment, and to quickly focus your attention on possible bottlenecks.

関連ドキュメント

The document was helpful.

評価を選択

I easily found the information I needed.

評価を選択