Databases Dashboard
The Databases dashboard contains the following elements:
Database Alarms
The Database Alarms pane shows the numbers alarms, by the severity level (Fatal, Critical, Warning, Normal, and Unknown). Use it as a starting point to quickly identify the sources of problems within your database infrastructure.

Database Environment Tiles
The Database Environment tiles display a high-level overview of your database environment. There is a tile for each type of database currently monitored by Foglight: All Instances, SQL Server, Oracle, Sybase, and DB2. Each tile shows how many of the corresponding object instances there are in your database infrastructure, and the count of objects of that type in each of the alarm states (Normal, Warning, Critical, Fatal).
Clicking the object type icon, the object type name, or the object count, shows summary information for that object type in the Databases Instances View. Clicking an alarm state (for example, Warning) on a tile displays summary information in the Databases Instances View for the objects in the selected state.

|
|
|
• |
Alarm counts. The total counts of alarms associated with the database instances, broken down by alarm types (Normal, Warning, Critical, Fatal). | |
|
|
|
|
|
Drill down on: |
|
|
|
|
|
|
Databases Instances View
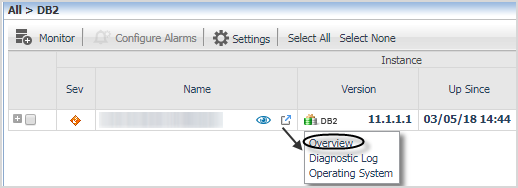
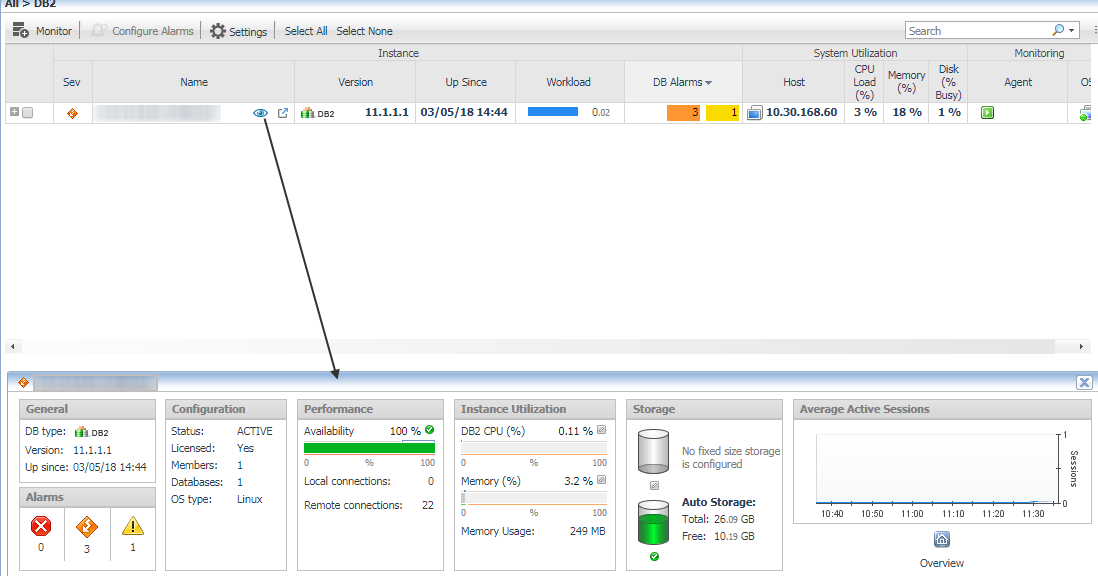
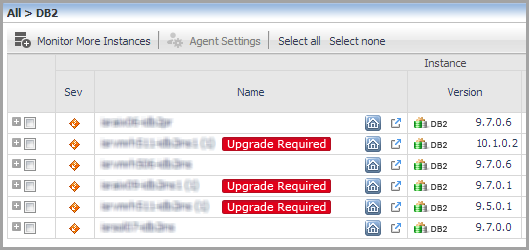
The Database Instances view displays a list of database instances. It displays all available database instances, or a filtered list. For more information about possible filters, see Instance home page .

|
|
|
• |
Database, Sev. The DB2 database instance’s highest severity alarm, used in Foglight to determine the instance’s health state. | |
|
|
|
|
|
|
|
|
|
• |
Database, Alarms. The number of Warning, Critical, and Fatal alarms for the DB2 database instance. The alarms are displayed by their severity levels, with the aggregated number for each severity. | |
|
|
|
|
|
|
|
|
|
• |
System Utilization, Memory (%). The amount of memory consumed by all OS processes (including the DB2 instance process). It includes both RAM resident memory and swapped memory. | |
|
|
|
• |
System Utilization, Disk (% Busy). The percentage of time the busiest device spent serving system-wide I/O requests. This metric serves as a measure for the system I/O load. | |
|
|
|
• |
Monitoring Status, Agent. The operational status of the monitoring agent. When the agent instance is running, hovering over the icon in the State column displays the status message Collecting Data. |
When the agent instance is running but not collecting data, hovering over the State icon displays one of the following status messages:
|
|
|
|
|
|
Drill down on: |
|
|
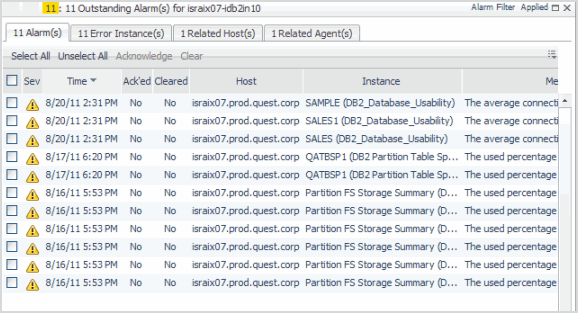
Database Alarms. Display the Outstanding Alarms dialog box.

The pop-up shows the most recent alarms generated for the specific database instance. To view additional information about an alarm, click its entry in the Sev column. The Alarm dialog box appears, showing details about the selected alarm.
For complete information about alarms in Foglight, see the Foglight User Help. |
|
|

|
|
|

|


