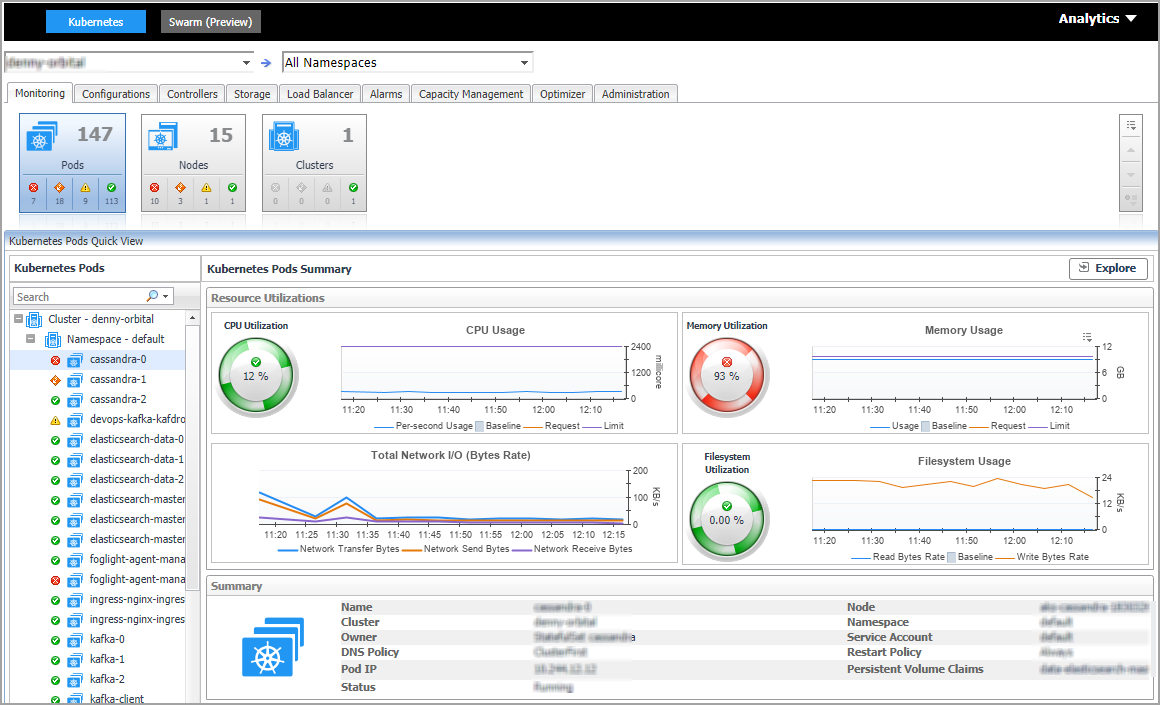
A pod contains one or multiple containers, such as Docker containers, which contains storage/network and the specification about how to run the containers. The Kubernetes Pods Quick View, which appears after clicking Monitoring > Pods, shows the data collected about the selected clusters and namespaces. This view consists of the following two panes:
|
• |
The Kubernetes Pods tree view, which appears on the left of Kubernetes Pods Quick View, lists the pods existing in the monitored Kubernetes environment. |
|
• |
The Kubernetes Pods Summary view, which appears on the right after you select an individual pod in the Kubernetes Pods tree view. |
The Kubernetes Pods Summary view appears on the right when you select a cluster in the Kubernetes Pods tree view.
The Kubernetes Pods Summary view displays the following data:
|
• |
Resource Utilizations: The resource utilization for the selected Kubernetes Pod over a selected period of time, which includes the following: |
|
• |
CPU Utilization: shows the percentage of CPU usage divides CPU limit, if the limit is configured for this Pod. |
|
• |
Memory Utilization: shows the percentage of Memory usage divides Memory limit, if the limit is configured for this Pod. |
|
• |
Total Network I/O: shows the sending, receiving, and transferring rate. |
|
• |
Filesystem Utilization: shows the Filesystem utilization. |
|
• |
Summary: Displays the detailed information about the selected Kubernetes Pod, including Name, Node, Cluster, Namespace, Owner, Pod IP, Service Account, DNS Policy, Restart Policy, and Status. |
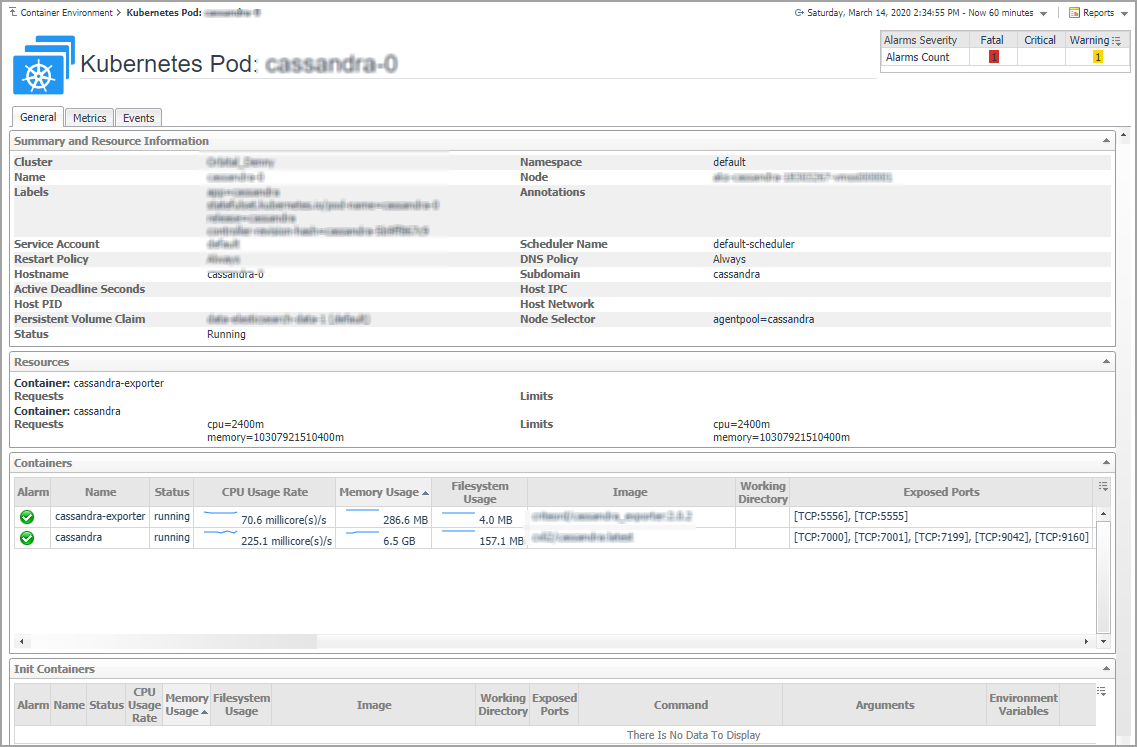
Click Explore on the upper right of the Kubernetes Pods Summary view to open the Pods Explorer view, which shows more detailed information about this Kubernetes cluster.
The Pods Explorer view opens when you click Explore in the Kubernetes Pods Summary view, which includes the following tabs:
|
• |
General tab: The General tab displays the overall information of the selected Kubernetes Pod over a selected period of time, including the Summary and Resource Information table, the Containers table, and the Init Containers table. For more information, see Pod metrics . |
|
• |
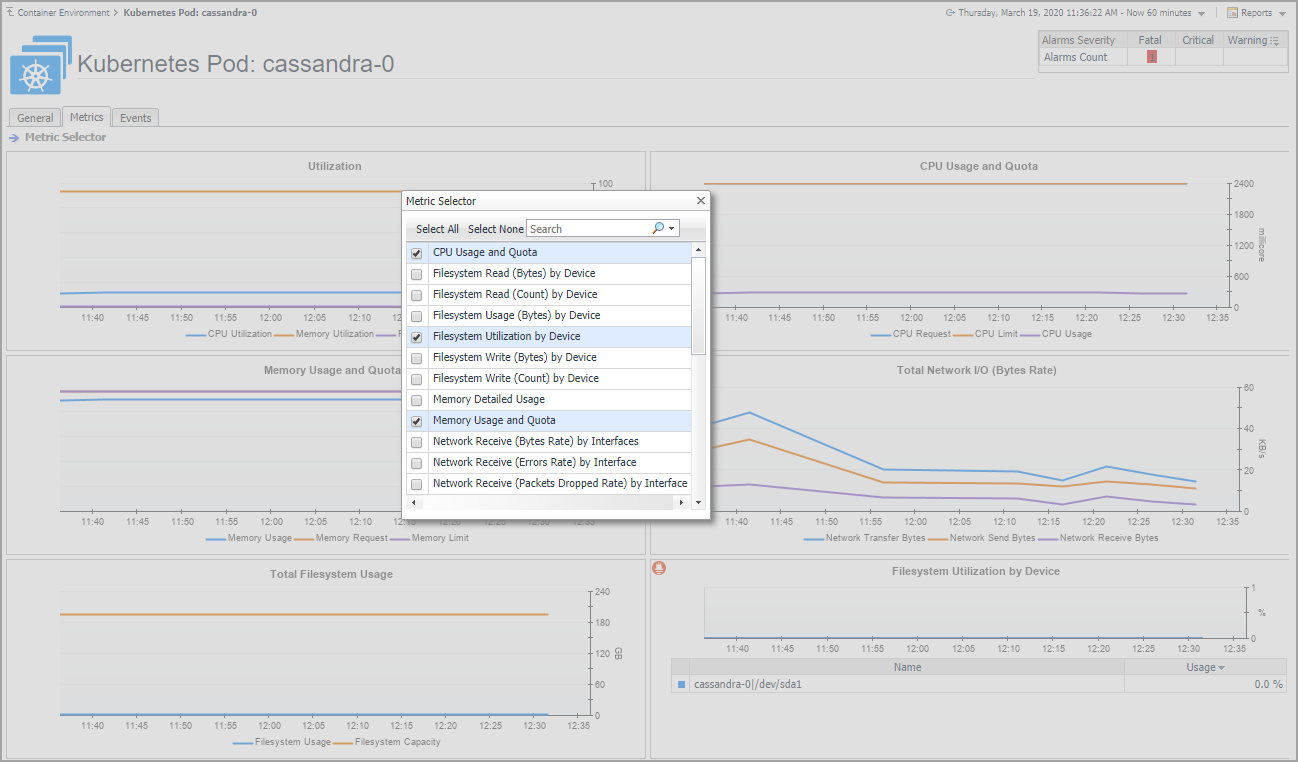
Metrics tab: The Metrics tab displays a Metric Selector allowing you to choose the metrics to be plotted on this dashboard. Charts of CPU Usage, Memory Usage, and Network I/O are presented by default. |
|
• |
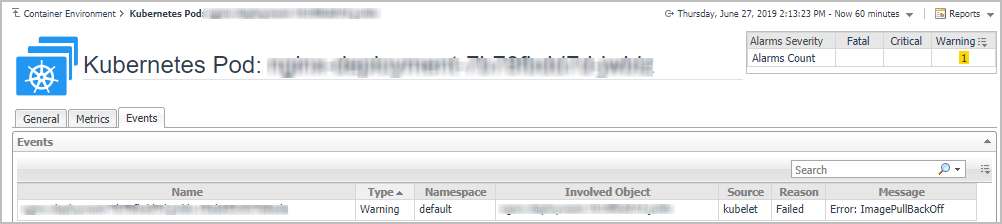
Event tab: The Event tab lists all the events occur on the pods. |
A node, previously known as a minion, is a worker machine in Kubernetes. A node may be a VM or physical machine, depending on the cluster. Each node has the services necessary to run pods and is managed by the master components. The Kubernetes Nodes Quick View, which appears after clicking Monitoring > Nodes, shows the data collected about the selected clusters and namespaces. This view consists of the following two panes:
|
• |
The Kubernetes Nodes tree view, which appears on the left of Kubernetes Nodes Quick View, lists the nodes existing in the monitored Kubernetes environment. |
|
• |
The Kubernetes Nodes Summary view, which appears on the right after you select an individual node in the Kubernetes Nodes tree view. |