Examining the structure of Application Servers services
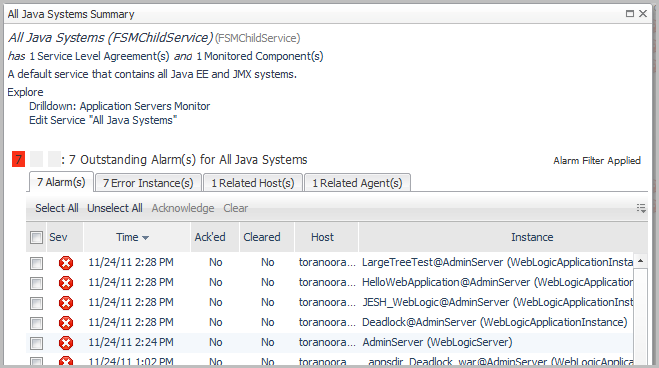
The Application Servers service category includes the All .NET Systems service, and the All Java Systems service, each of which in turn can be comprised of one or more services. For example, the All Java Systems service could include the following services:
Each service has components or sub-components that are monitored by a rule.
A component has its own alarms and Service Level Compliance (availability) status. The status of each component rolls up to provide an overall Service Level Compliance and alarm status for a service. From the Service Builder dashboard, you can explore how a service is built. You may want to examine this composition to see which components are contributing to the poor health.
|
1 |
|
2 |
Expand the Application Servers service category. The grouping underneath the service category appears. |
|
1 |
|
2 |
Under the Explore heading, click Drilldown: Application Servers Monitor to view the details of the service in the Application Servers Monitor dashboard. |
For more information about Services and Service Level Agreements, see Monitoring Your Services in the Foglight User Guide.
Monitoring Systems
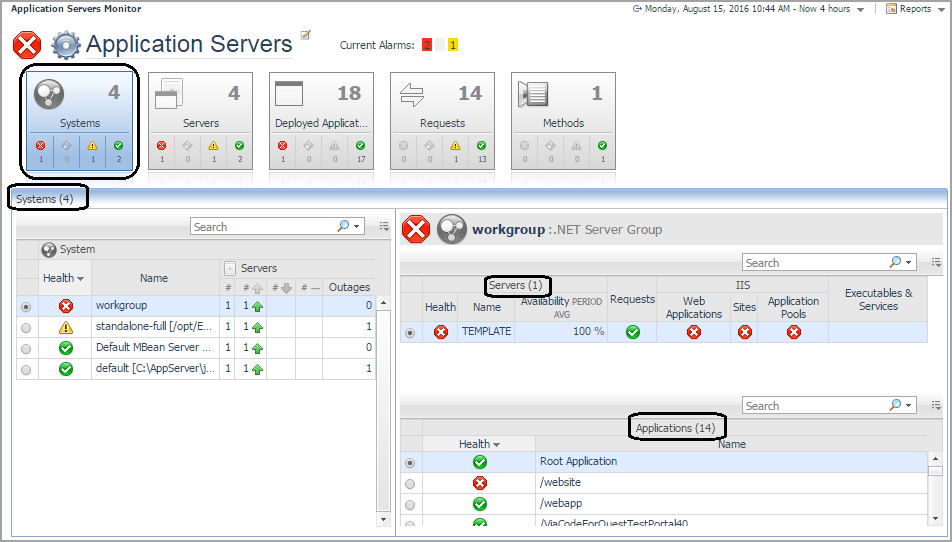
The Systems and Servers views of the Application Servers Monitor dashboard are common to Foglight for Microsoft .NET, Foglight for Java EE Technologies, and Foglight for JMX. This section describes the features and functionality of these two views, and the related Java Virtual Machine (JVM) view.
From this view, you can perform the following actions:
|
1 |
On the navigation panel, under Dashboards, click Application Servers > Monitor. The Application Servers Monitor dashboard opens. |
|
2 |
Click the Systems tile. |
Systems
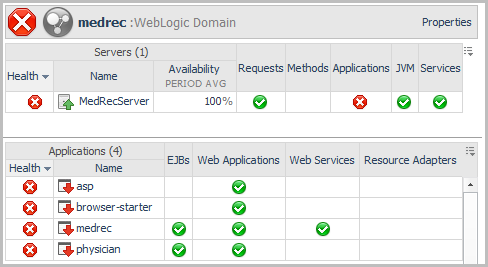
For example, the health of a WebLogic_10 system is poor (), because one server and six applications are unavailable (
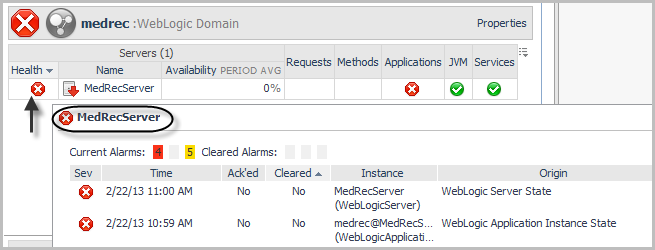
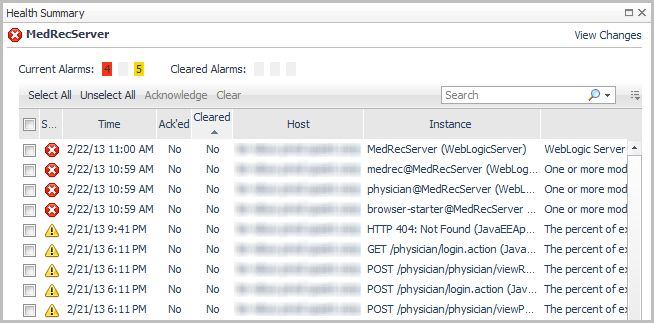
). Click the status icon for an affected component (system, server, or application) to obtain information about the source. For more information, see Reviewing the health of your systems.
To review the properties for the selected system, click Properties (at the top right corner of the Systems Details view). The information available in this pop-up depends on the type of system selected.
For more information, see Reviewing the health of your systems.
Reviewing the health of your systems
|
• |
|
1 |
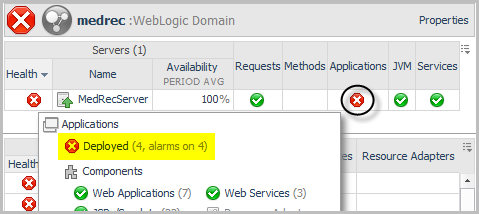
In the Applications column of the Servers table, click the health status icon. |
|
2 |
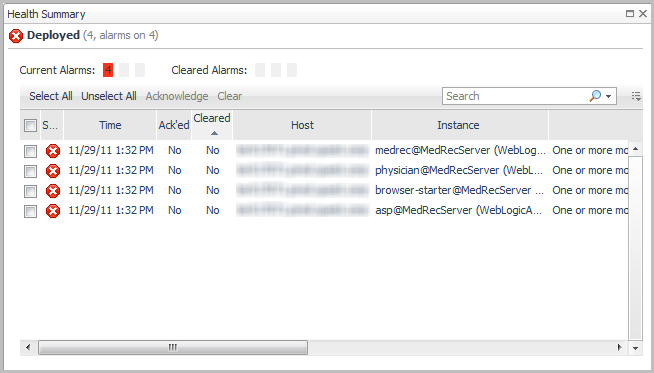
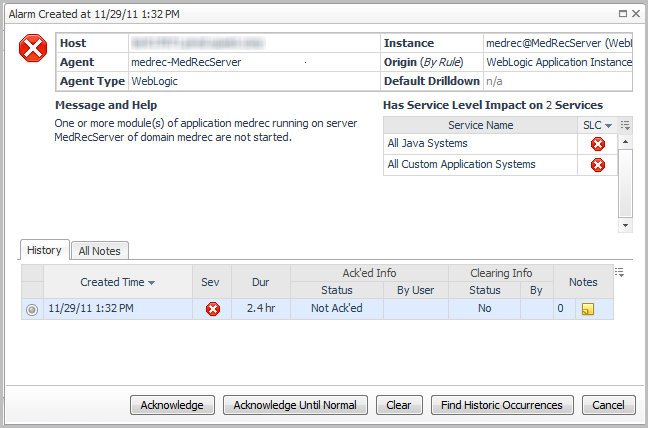
Click the Deployed health status icon. |


